Localization of a susceptibility gene for type 2 diabetes to chromosome 5q34-q35.2
- PMID: 12851856
- PMCID: PMC1180371
- DOI: 10.1086/377139
Localization of a susceptibility gene for type 2 diabetes to chromosome 5q34-q35.2
Abstract
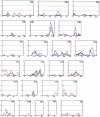
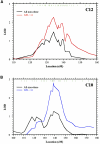
We report a genomewide linkage study of type 2 diabetes (T2D [MIM 125853]) in the Icelandic population. A list of type 2 diabetics was cross-matched with a computerized genealogical database clustering 763 type 2 diabetics into 227 families. The diabetic patients and their relatives were genotyped with 906 microsatellite markers. A nonparametric multipoint linkage analysis yielded linkage to 5q34-q35.2 (LOD = 2.90, P=1.29 x 10(-4)) in all diabetics. Since obesity, here defined as body mass index (BMI) > or =30 kg/m(2), is a key risk factor for the development of T2D, we studied the data either independently of BMI or by stratifying the patient group as obese (BMI > or =30) or nonobese (BMI <30). A nonparametric multipoint linkage analysis yielded linkage to 5q34-q35.2 (LOD = 3.64, P=2.12 x (10)-5) in the nonobese diabetics. No linkage was observed in this region for the obese diabetics. Linkage analysis conditioning on maternal transmission to the nonobese diabetics resulted in a LOD score of 3.48 (P=3.12 x 10(-5)) in the same region, whereas conditioning on paternal transmission led to a substantial drop in the LOD score. Finally, we observed potential interactions between the 5q locus and two T2D susceptibility loci, previously mapped in other populations.
Figures


Similar articles
-
Possible genomic imprinting of three human obesity-related genetic loci.Am J Hum Genet. 2005 Mar;76(3):427-37. doi: 10.1086/428438. Epub 2005 Jan 12. Am J Hum Genet. 2005. PMID: 15647995 Free PMC article.
-
Genome-wide linkage analysis assessing parent-of-origin effects in the inheritance of type 2 diabetes and BMI in Pima Indians.Diabetes. 2001 Dec;50(12):2850-7. doi: 10.2337/diabetes.50.12.2850. Diabetes. 2001. PMID: 11723070
-
Localization of a susceptibility gene for common forms of stroke to 5q12.Am J Hum Genet. 2002 Mar;70(3):593-603. doi: 10.1086/339252. Epub 2002 Feb 6. Am J Hum Genet. 2002. PMID: 11833004 Free PMC article.
-
Genomewide scan and fine mapping of quantitative trait loci for intraocular pressure on 5q and 14q in West Africans.Invest Ophthalmol Vis Sci. 2006 Aug;47(8):3262-7. doi: 10.1167/iovs.05-1537. Invest Ophthalmol Vis Sci. 2006. PMID: 16877390
-
Genomewide search in familial Paget disease of bone shows evidence of genetic heterogeneity with candidate loci on chromosomes 2q36, 10p13, and 5q35.Am J Hum Genet. 2001 Nov;69(5):1055-61. doi: 10.1086/323798. Epub 2001 Sep 5. Am J Hum Genet. 2001. PMID: 11555792 Free PMC article.
Cited by
-
The role of the Wnt signaling pathway in incretin hormone production and function.Front Physiol. 2012 Jul 12;3:273. doi: 10.3389/fphys.2012.00273. eCollection 2012. Front Physiol. 2012. PMID: 22934027 Free PMC article.
-
Identification of shared genetic susceptibility locus for coronary artery disease, type 2 diabetes and obesity: a meta-analysis of genome-wide studies.Cardiovasc Diabetol. 2012 Jun 14;11:68. doi: 10.1186/1475-2840-11-68. Cardiovasc Diabetol. 2012. PMID: 22697793 Free PMC article. Review.
-
Common variants in HNF-1 alpha and risk of type 2 diabetes.Diabetologia. 2006 Dec;49(12):2882-91. doi: 10.1007/s00125-006-0450-x. Epub 2006 Oct 11. Diabetologia. 2006. PMID: 17033837
-
Linkage of Crohn's disease-related serological phenotypes: NFKB1 haplotypes are associated with anti-CBir1 and ASCA, and show reduced NF-kappaB activation.Gut. 2009 Jan;58(1):60-7. doi: 10.1136/gut.2008.156422. Epub 2008 Oct 2. Gut. 2009. PMID: 18832525 Free PMC article.
-
Parent-of-Origin Effects of the APOB Gene on Adiposity in Young Adults.PLoS Genet. 2015 Oct 9;11(10):e1005573. doi: 10.1371/journal.pgen.1005573. eCollection 2015 Oct. PLoS Genet. 2015. PMID: 26451733 Free PMC article.
References
Electronic-Database Information
-
- Cybergenetics, http://www.cybgen.com/ (for True Allele program)
-
- deCODE Genetics, http://www.decode.com/diabetes/markermaps/ (for marker maps in linkage analysis)
-
- International Obesity Task Force, http://www.iotf.org/
-
- Online Mendelian Inheritance in Man (OMIM), http://www.ncbi.nlm.nih.gov/Omim/
-
- UCSC Genome Bioinformatics, http://genome.ucsc.edu/
References
-
- Altshuler D, Hirschhorn JN, Klannemark M, Lindgren CM, Vohl MC, Nemesh J, Lane CR, Schaffner SF, Bolk S, Brewer C, Tuomi T, Gaudet D, Hudson TJ, Daly M, Groop L, Lander ES (2000) The common PPARgamma Pro12Ala polymorphism is associated with decreased risk of type 2 diabetes. Nat Genet 26:76–80 - PubMed
-
- Barker DJ, Hales CN, Fall CH, Osmond C, Phipps K, Clark PM (1993) Type 2 (non-insulin-dependent) diabetes mellitus, hypertension and hyperlipidaemia (syndrome X): relation to reduced fetal growth. Diabetologia 36:62–67 - PubMed
-
- Bray GA (1987) Overweight is risking fate. Definition, classification, prevalence, and risks. Ann N Y Acad Sci 499:14–28 - PubMed
MeSH terms
LinkOut - more resources
Full Text Sources
Other Literature Sources
Medical
Molecular Biology Databases

