. 2003 Sep;92(3):415-24.
doi: 10.1093/aob/mcg146. Epub 2003 Jul 9.

Do genetic make-up and growth manipulation affect tomato fruit size by cell number, or cell size and DNA endoreduplication?

Affiliations

Do genetic make-up and growth manipulation affect tomato fruit size by cell number, or cell size and DNA endoreduplication?

N Bertin et al. Ann Bot. 2003 Sep.

Abstract

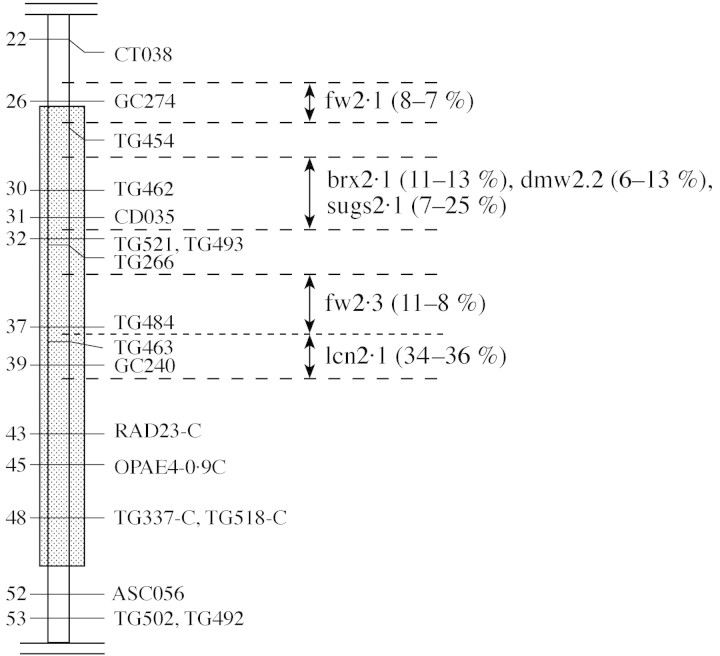
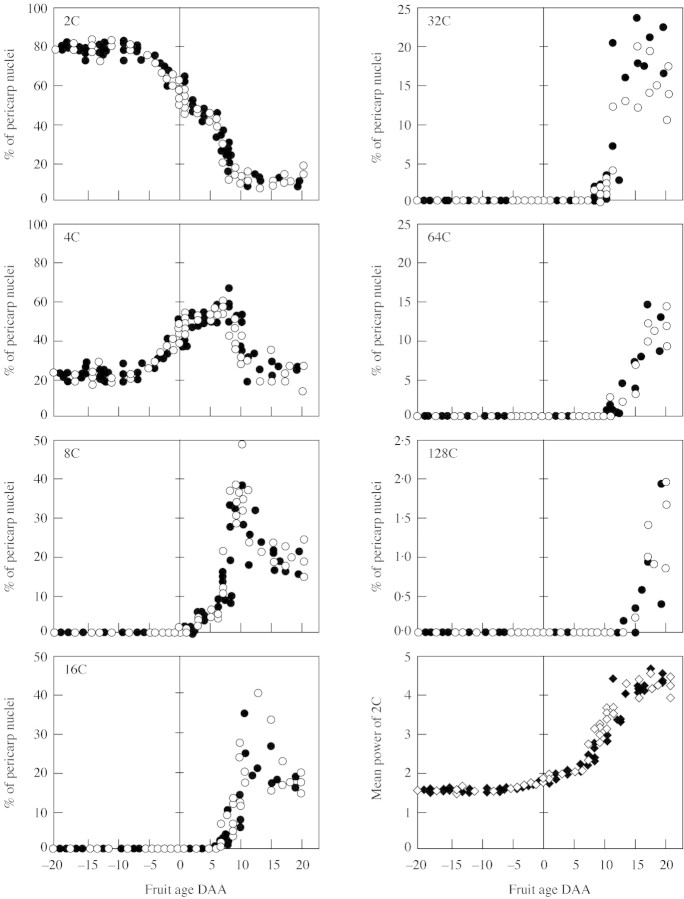
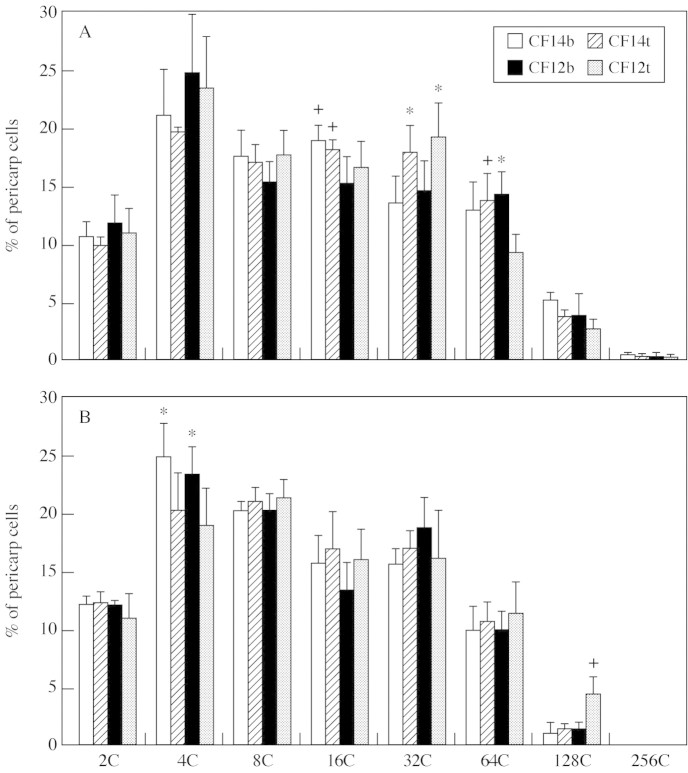
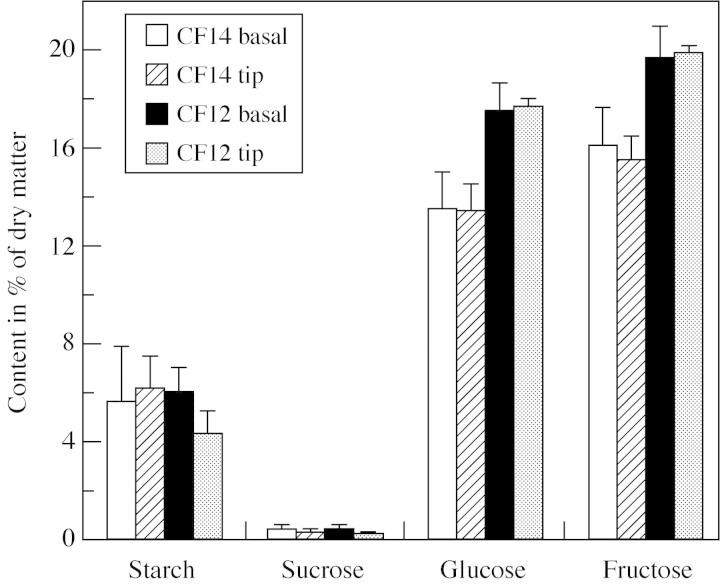
This work investigated the link between genetic and developmental controls of fruit size and composition. On two isogenic lines (CF12-C and CF14-L), differing by fruit weight and sugar content quantitative trait loci (QTLs) identified previously, basal and tip fruits were characterized at anthesis and at maturity through their growth, dry matter and sugar content, number and size of cells and nuclei DNA content. The influence of competition was assessed by removing either basal or tip ovaries at anthesis. On an intact inflorescence, CF12-C fruits grew less than CF14-L fruits, with 1.67 fewer cell layers and similar cell size, suggesting that genes controlling cell division may be responsible for this fruit size variation. Truss thinning masked the QTL effect on fruit size, mainly by reducing the difference in cell number between the two lines and by promoting cell expansion in tip fruits, so that fruit growth was similar at both positions and for both lines. Thus, in these lines, cell number exerts a control on final fruit size only when there is competition among fruits. Different responses of basal and tip fruits after flower removal suggested that this treatment induced changes in hormonal relationships within the truss. No fixed relationship between DNA endoreduplication and cell size was found, as while cell size and dry matter and sugar contents differed with tomato lines, fruit position and truss size, endoreduplication patterns were the same. CF12-C fruits had a higher dry matter (+0.3% of fresh weight) and carbohydrates (+8% of dry matter) content than CF14-L fruits. The percentage dry matter was independent of truss size but decreased slightly from basal to tip fruits.


Figures

None
Fig. 1. Map of the region of chromosome 2 where the CF12-C and CF14-L near-isogenic lines differ (hatched). Distances on the left of the chromosome are centimorgans from the top of the chromosome. The four intervals where QTLs were finely located are indicated on the right, with their codes (fw, fruit weight; brx, soluble solid content; sugs and dmw, reducing sugars and dry matter content; lcn, locular number). The effects of the QTLs, expressed as percentage of average difference, detected in two glasshouse trials, are in parentheses (adapted from Lecomte et al., 2003).
None
Fig. 2. Microscopic characterization of CF12-C and CF14-L fruits. A, Half equatorial section of a CF12-C ovary sampled at anthesis; B, pericarp portion of a CF14-L ovary at anthesis; C, pericarp portion of a CF12-C basal MG fruit; D, a CF14-L tip MG fruit sampled in the pruned experiment. The rectangle represents the 2·5 mm long region of interest (ROI), in which cells have been coloured according to their class of section area, except for the outer and inner epidermis, for the first two to four layers of very small cells below the outer epidermis and for the vascular bundles (eight 0·02 mm2 wide classes, increasing order: red, yellow, bright blue, cyan, green, brown, dark blue). c, Columella; ie, inner epidermis; o, ovule; p, pericarp; oe, outer epidermis; s, septum; vb, vascular bundle.
None
Fig. 3. Growth curves of basal (filled symbols) and tip (open symbols) fruits measured in the competition (A and C) and pruned (B and D) experiments for the CF14-L (A and B) and CF12-C line (C and D). Individual points are experimental data measured on 12 different fruits for each treatment. Full and broken lines represent the non-linear adjustment of a three-parameter Gompertz function for basal and tip fruits, respectively (R2 > 0·98 in all cases; standard error of estimate = 0·6–1·12).
None
Fig. 4. Relationship between ovary diameter and cell number measured at anthesis in basal (circles) and tip (triangles) ovaries of CF12-C (open symbols) and CF14-L (filled symbols) tomato lines. Data are means of six replicates and vertical bars represent 95 % confidence intervals of the measurements.
None
Fig. 5. Change during ovary and fruit development of the percentages of pericarp nuclei distributed according to their DNA content from 2C to 128C. The last figure represents the change of n, the mean power of 2Cn DNA amount. Filled and open symbols represent, respectively, the CF14-L and CF12-C tomato lines. Each point is an individual fruit of the pruned experiment.
None
Fig. 6. Distribution of pericarp nuclei according to their DNA content from 2C to 256C in competition (A) and pruned (B) experiments at basal (CF14b, CF12b) and tip fruit positions (CF14t, CF12t). Data are means of three MG fruits and each measurement is the mean of three replicates per fruit. Vertical bars represent 95 % confidence intervals. + and * indicate significant differences (P < 0·05) between, respectively, the two tomato lines for a given fruit position and the two fruit positions for a given tomato line.
None
Fig. 7. Starch, sucrose, glucose and fructose content as a percentage of dry matter measured in CF14-L and CF12-C tomatoes at basal and tip fruit positions in the pruned experiment. Data are means of four MG fruits and vertical bars represent 95 % confidence intervals.

References

    1. BangerthF, Ho LC.1984. Fruit position and fruit set sequence in a truss as factors determining final size of tomato fruits. Annals of Botany 53: 315–319.
    1. BergervoetJHW, Verhoeven HA, Gilissen LJW, Bino RJ.1996. High amounts of nuclear DNA in tomato (Lycopersicon esculentum Mill.) pericarp. Plant Science 116: 141–145.
    1. BertinN, Gautier H, Roche C.2002. Number of cells in tomato fruit depending on fruit position and source-sink balance during plant development. Plant Growth Regulation 36: 105–112.
    1. BohnerJ, Bangerth F.1988a. Effects of fruit set sequence and defoliation on cell number, cell size and hormone levels of tomato fruits (Lycopersicon esculentum Mill.) within a truss. Plant Growth Regulation 7: 141–155.
    1. BohnerJ, Bangerth F.1988b. Cell number, cell size and hormone levels in semi-isogenic mutants of Lycopersicon pimpinellifolium differing in fruit size. Physiologia Plantarum 72: 316–320.