

Prostaglandin E2 activates the histaminergic system via the EP4 receptor to induce wakefulness in rats
- PMID: 12853415
- PMCID: PMC6740344
- DOI: 10.1523/JNEUROSCI.23-14-05975.2003
Prostaglandin E2 activates the histaminergic system via the EP4 receptor to induce wakefulness in rats
Abstract
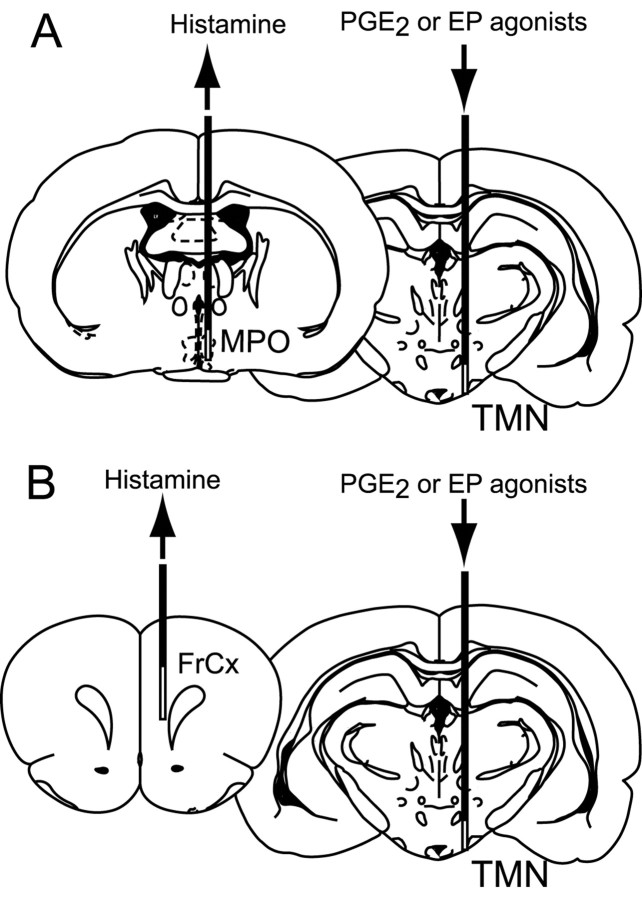
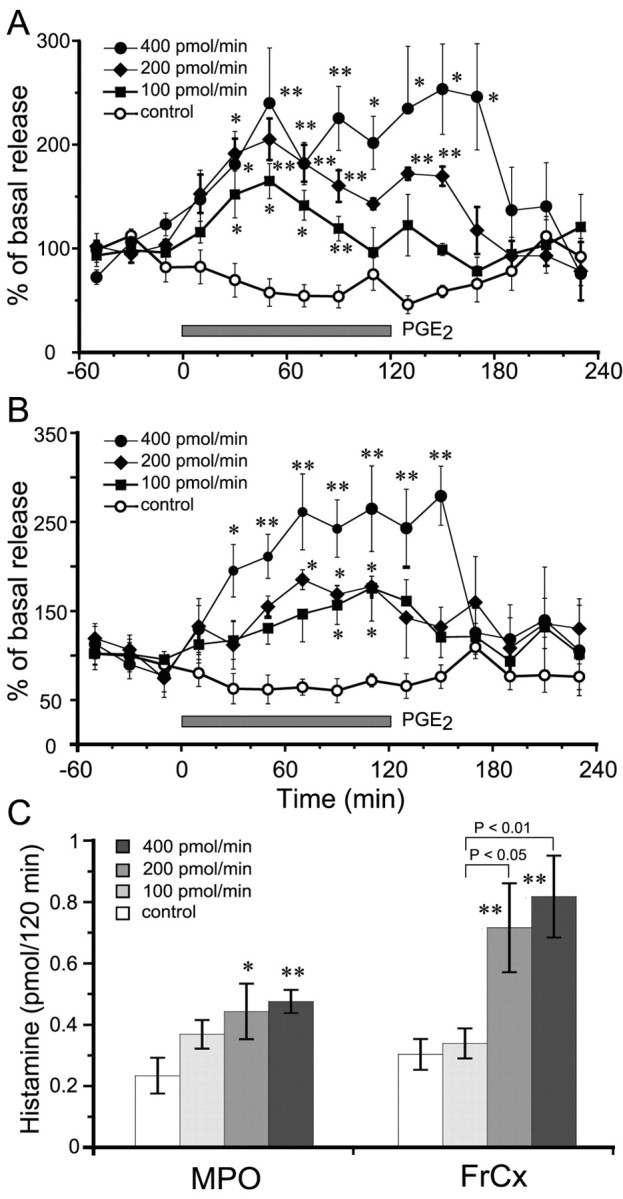
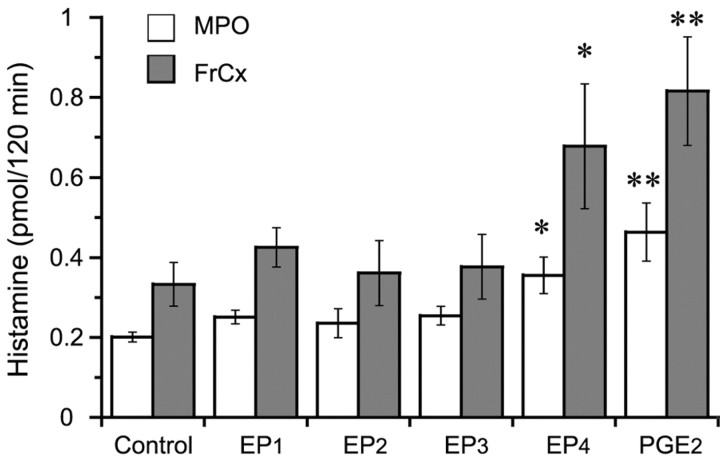
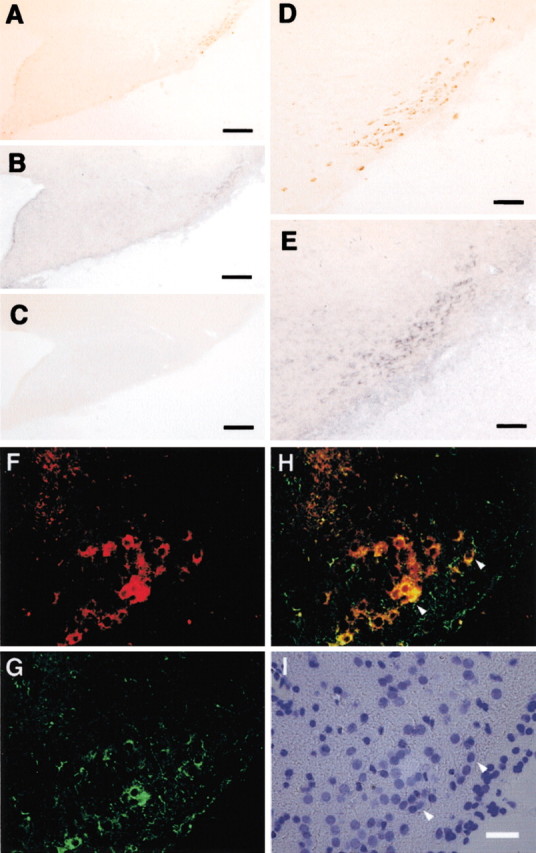
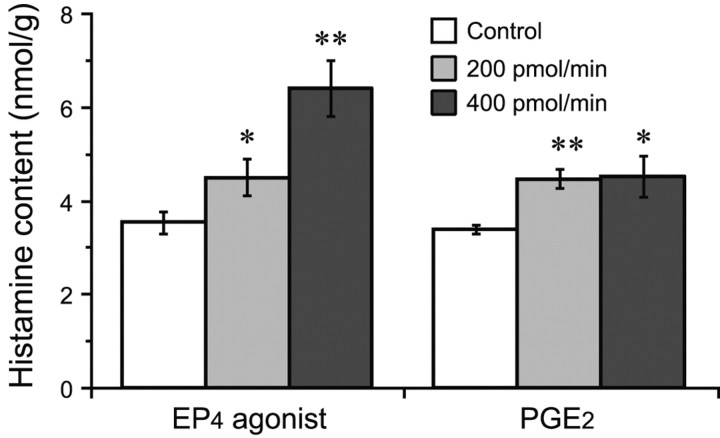
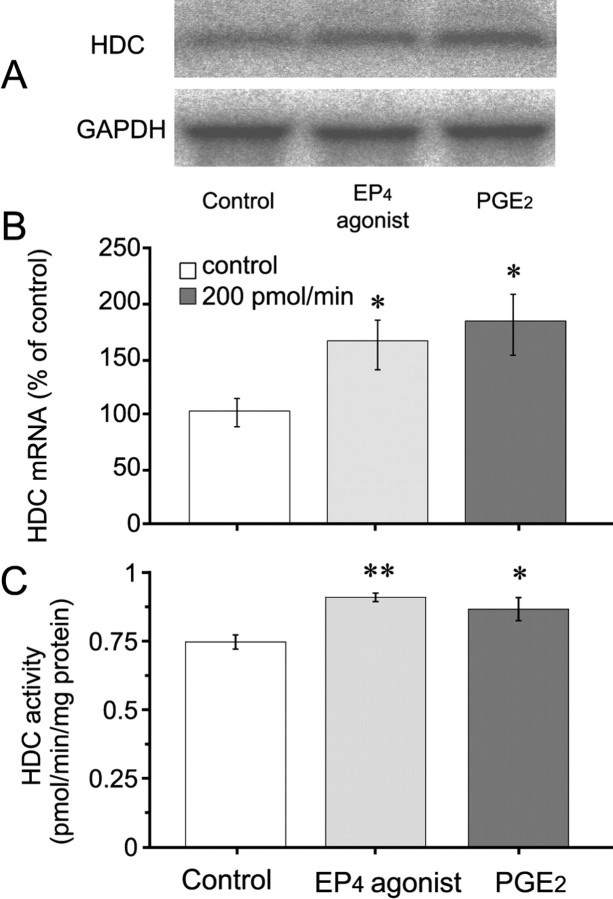
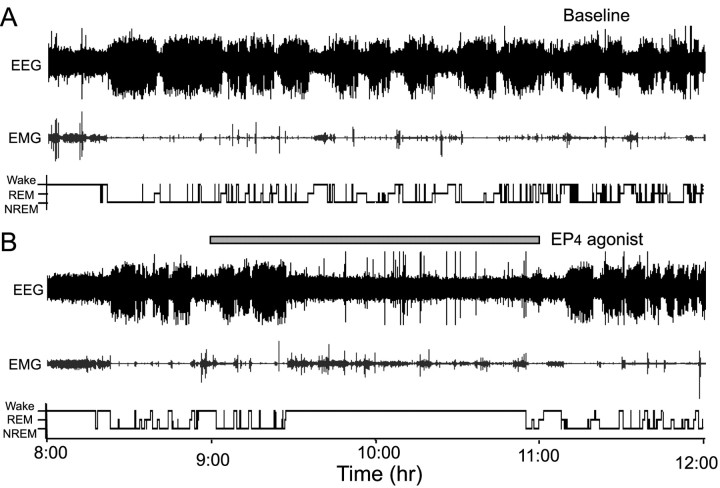
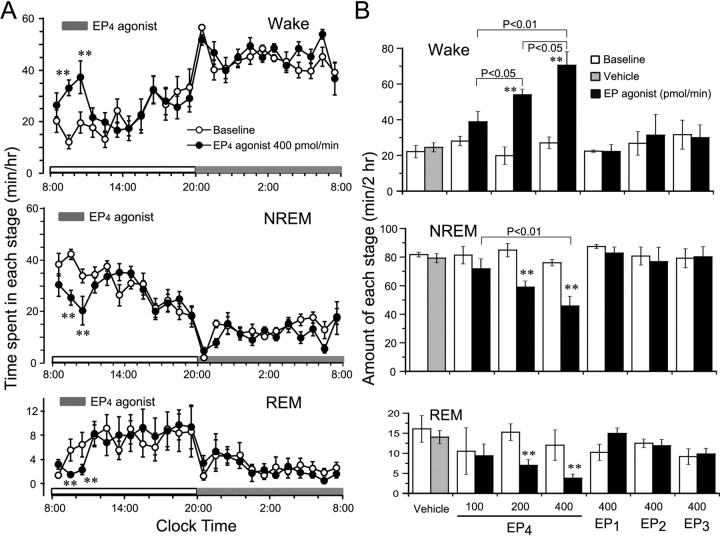
Prostaglandin (PG)E2 promotes the wakeful state when administered into the posterior hypothalamus, in which the histaminergic tuberomammillary nucleus (TMN) is located. To explore the neurotransmitter mechanisms responsible for PGE2-induced wakefulness in rats, we examined the effect of PGE2 on the activity of the histaminergic system and the involvement of PGE2 receptor subtypes in the response. PGE2 perfusion in the TMN at doses of 100, 200, and 400 pmol/min for 2 hr significantly increased histamine release from the medial preoptic area and frontal cortex in a dose-dependent manner, as measured by in vivo microdialysis. Among the agonists of the four distinct subtypes of PGE2 receptors (EP1-4) tested, only the EP4 receptor agonist (ONO-AE1-329) mimicked the excitatory effect of PGE2 on histamine release from both the medial preoptic area and frontal cortex. Perfusion of either PGE2 or the EP4 agonist into the TMN at a dose of 200 pmol/min for 1 hr increased histidine decarboxylase activity, histidine decarboxylase mRNA level, and histamine content in the hypothalamus. In situ hybridization revealed that EP4 receptor mRNA was expressed in histidine decarboxylase-immunoreactive neurons of the TMN region. Furthermore, EP4 agonist perfusion into the TMN induced wakefulness. These findings indicate that PGE2 induces wakefulness through activation of the histaminergic system via EP4 receptors.
Figures
Similar articles
-
Arousal effect of orexin A depends on activation of the histaminergic system.Proc Natl Acad Sci U S A. 2001 Aug 14;98(17):9965-70. doi: 10.1073/pnas.181330998. Epub 2001 Aug 7. Proc Natl Acad Sci U S A. 2001. PMID: 11493714 Free PMC article.
-
Prostaglandin E2-induced modification of tetrodotoxin-resistant Na+ currents involves activation of both EP2 and EP4 receptors in neonatal rat nodose ganglion neurones.Br J Pharmacol. 2005 Jun;145(4):503-13. doi: 10.1038/sj.bjp.0706212. Br J Pharmacol. 2005. PMID: 15821755 Free PMC article.
-
Heterogeneity of histaminergic neurons in the tuberomammillary nucleus of the rat.Eur J Neurosci. 2009 Jun;29(12):2363-74. doi: 10.1111/j.1460-9568.2009.06765.x. Epub 2009 May 22. Eur J Neurosci. 2009. PMID: 19490084
-
[Advances in the study of histaminergic systems and sleep-wake regulation].Yao Xue Xue Bao. 2011 Mar;46(3):247-52. Yao Xue Xue Bao. 2011. PMID: 21626776 Review. Chinese.
-
Prostaglandin E2 as a mediator of fever: the role of prostaglandin E (EP) receptors.Front Biosci. 2004 Sep 1;9:3046-57. doi: 10.2741/1458. Front Biosci. 2004. PMID: 15353336 Review.
Cited by
-
Chronic sleep restriction during development can lead to long-lasting behavioral effects.Physiol Behav. 2016 Mar 1;155:208-17. doi: 10.1016/j.physbeh.2015.12.019. Epub 2015 Dec 19. Physiol Behav. 2016. PMID: 26712276 Free PMC article.
-
Altered sleep-wake characteristics and lack of arousal response to H3 receptor antagonist in histamine H1 receptor knockout mice.Proc Natl Acad Sci U S A. 2006 Mar 21;103(12):4687-92. doi: 10.1073/pnas.0600451103. Epub 2006 Mar 13. Proc Natl Acad Sci U S A. 2006. PMID: 16537376 Free PMC article.
-
Functions and Mechanisms of Sleep.AIMS Neurosci. 2016;3(1):67-104. doi: 10.3934/Neuroscience.2016.1.67. Epub 2016 Apr 21. AIMS Neurosci. 2016. PMID: 28413828 Free PMC article.
-
Arachidonic acid metabolism in brain physiology and pathology: lessons from genetically altered mouse models.J Neurochem. 2007 Aug;102(3):577-86. doi: 10.1111/j.1471-4159.2007.04558.x. Epub 2007 Apr 2. J Neurochem. 2007. PMID: 17403135 Free PMC article. Review.
-
[Association between sleep disorders and vestibular vertigo].Lin Chuang Er Bi Yan Hou Tou Jing Wai Ke Za Zhi. 2024 Sep;38(9):866-871. doi: 10.13201/j.issn.2096-7993.2024.09.018. Lin Chuang Er Bi Yan Hou Tou Jing Wai Ke Za Zhi. 2024. PMID: 39193749 Free PMC article. Review. Chinese.
References
-
- Chou TC, Gerashchenko D, Saper CB, Shiromani PJ ( 2001) Loss of histaminergic neurons does not produce hypersomnolence. Soc Neurosci Abstr 27: 1.1378.
-
- Coleman RA, Smith WL, Narumiya S ( 1994) International Union of Pharmacology classification of prostanoid receptors: properties, distribution, and structure of the receptors and their subtypes. Pharmacol Rev 46: 205–229. - PubMed
-
- Denoyer M, Sallanon M, Buda C, Kitahama K, Jouvet M ( 1991) Neurotoxic lesion of the mesencephalic reticular formation and/or the posterior hypothalamus does not alter waking in the cat. Brain Res 539: 287–303. - PubMed
-
- Gerozissis K, De Saint Hilaire Z, Orosco M, Rouch C, Nicolaidis S ( 1995) Changes in hypothalamic prostaglandin E2 may predict the occurrence of sleep or wakefulness as assessed by parallel EEG and microdialysis in the rat. Brain Res 689: 239–244. - PubMed
-
- Haas H, Panula P ( 2003) The role of histamine and the tuberomamillary nucleus in the nervous system. Nat Rev Neurosci 4: 121–130. - PubMed
Publication types
MeSH terms
Substances
LinkOut - more resources
Full Text Sources
Other Literature Sources
Miscellaneous