c-fos reduces corticosterone-mediated effects on neurotrophic factor expression in the rat hippocampal CA1 region
- PMID: 12853419
- PMCID: PMC6740350
- DOI: 10.1523/JNEUROSCI.23-14-06013.2003
c-fos reduces corticosterone-mediated effects on neurotrophic factor expression in the rat hippocampal CA1 region
Abstract
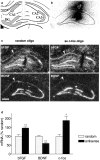
The transcription of neurotrophic factors, i.e., basic fibroblast growth factor (bFGF) and brain-derived neurotrophic factor (BDNF) is regulated by glucocorticoid receptor (GR) and mineralocorticoid receptor (MR) activation despite the lack of a classical glucocorticoid response element in their promoter region. A time course for corticosterone (10 mg/kg, s.c.) in adrenalectomized rats revealed a peak hormone effect at the 4 hr time interval for bFGF (110-204% increase), BDNF (53-67% decrease), GR (53-64% decrease), and MR (34-56% decrease) mRNA levels in all hippocampal subregions using in situ hybridization. c-fos mRNA levels were affected exclusively in the dentate gyrus after 50 min to 2 hr (38-46% decrease). Furthermore, it was evaluated whether corticosterone regulation of these genes depends on interactions with the transcription factor complex activator protein-1. c-fos antisense oligodeoxynucleotides were injected into the dorsal hippocampus of adrenalectomized rats. Corticosterone was given 2 hr later, and the effects on gene expression were measured 4 hr later. In CA1, antisense treatment significantly and selectively enhanced the hormone action on the expression of bFGF (44% enhanced increase) and BDNF (38% enhanced decrease) versus control oligodeoxynucleotide treatment. In addition, an upregulation of c-fos expression (89% increase) was found. There were no effects of c-fos antisense on hippocampal GR and MR expression. Thus it seems that a tonic c-fos mechanism exists within CA1, which reduces GR- and MR-mediated effects on expression of bFGF and BDNF.
Figures


Similar articles
-
Gluco- and mineralocorticoid receptor-mediated regulation of neurotrophic factor gene expression in the dorsal hippocampus and the neocortex of the rat.Eur J Neurosci. 2000 Aug;12(8):2918-34. doi: 10.1046/j.1460-9568.2000.00185.x. Eur J Neurosci. 2000. PMID: 10971634
-
Time-course of immediate early gene expression in hippocampal subregions of adrenalectomized rats after acute corticosterone challenge.Brain Res. 2008 Jun 18;1215:1-10. doi: 10.1016/j.brainres.2008.03.080. Epub 2008 Apr 10. Brain Res. 2008. PMID: 18485334 Free PMC article.
-
Glucocorticoids and the expression of mRNAs for neurotrophins, their receptors and GAP-43 in the rat hippocampus.Brain Res Mol Brain Res. 1994 Oct;26(1-2):271-6. doi: 10.1016/0169-328x(94)90099-x. Brain Res Mol Brain Res. 1994. PMID: 7854057
-
Androgens modulate glucocorticoid receptor mRNA, but not mineralocorticoid receptor mRNA levels, in the rat hippocampus.J Neuroendocrinol. 1996 Jun;8(6):439-47. doi: 10.1046/j.1365-2826.1996.04735.x. J Neuroendocrinol. 1996. PMID: 8809674
-
Corticosterone effects on BDNF expression in the hippocampus. Implications for memory formation.Stress. 2000 May;3(3):201-8. doi: 10.3109/10253890009001124. Stress. 2000. PMID: 10938581 Review.
Cited by
-
Models and mechanisms for hippocampal dysfunction in obesity and diabetes.Neuroscience. 2015 Nov 19;309:125-39. doi: 10.1016/j.neuroscience.2015.04.045. Epub 2015 Apr 28. Neuroscience. 2015. PMID: 25934036 Free PMC article. Review.
-
Behavioral and neurobiological effects of the enkephalinase inhibitor RB101 relative to its antidepressant effects.Eur J Pharmacol. 2006 Feb 15;531(1-3):151-9. doi: 10.1016/j.ejphar.2005.12.002. Epub 2006 Jan 25. Eur J Pharmacol. 2006. PMID: 16442521 Free PMC article.
-
Dissociable Role of Corticotropin Releasing Hormone Receptor Subtype 1 on Dopaminergic and D1 Dopaminoceptive Neurons in Cocaine Seeking Behavior.Front Behav Neurosci. 2017 Nov 13;11:221. doi: 10.3389/fnbeh.2017.00221. eCollection 2017. Front Behav Neurosci. 2017. PMID: 29180955 Free PMC article.
-
Modification of hippocampal markers of synaptic plasticity by memantine in animal models of acute and repeated restraint stress: implications for memory and behavior.Neuromolecular Med. 2015 Jun;17(2):121-36. doi: 10.1007/s12017-015-8343-0. Epub 2015 Feb 14. Neuromolecular Med. 2015. PMID: 25680935
-
Restraint stress alters nociceptin/orphanin FQ and CRF systems in the rat central amygdala: significance for anxiety-like behaviors.J Neurosci. 2014 Jan 8;34(2):363-72. doi: 10.1523/JNEUROSCI.2400-13.2014. J Neurosci. 2014. PMID: 24403138 Free PMC article.
References
-
- Asanuma M, Ogawa N, Hirata H, Chou H, Tanaka K, Mori A ( 1992) Opposite effects of rough and gentle handling with repeated saline administration on c-fos mRNA expression in the rat brain. J Neural Transm 90: 163–169. - PubMed
-
- Autelitano DJ ( 1994) Glucocorticoid regulation of c-fos, c-jun and transcription factor AP-1 in the AtT-20 corticotrope cell. J Neuroendocrinol 6: 627–637. - PubMed
-
- Baille V, Lallement G, Carpentier P, Foquin A, Pernot-Marino I, Rondouin G ( 1997) C-fos antisense oligonucleotide prevents delayed induction of hsp70 mRNA after soman-induced seizures. NeuroReport 8: 1819–1822. - PubMed
-
- Barbany G, Persson H ( 1992) Regulation of neurotrophin mRNA expression in the rat brain by glucocorticoids. Eur J Neurosci 4: 396–403. - PubMed
-
- Beato M, Herrlich P, Schütz G ( 1995) Steroid hormones receptors: many actors in search of a plot. Cell 83: 851–857. - PubMed
Publication types
MeSH terms
Substances
LinkOut - more resources
Full Text Sources
Research Materials
Miscellaneous
