. 2003 Jul 9;23(14):6063-73.
doi: 10.1523/JNEUROSCI.23-14-06063.2003.

Light-evoked excitatory and inhibitory synaptic inputs to ON and OFF alpha ganglion cells in the mouse retina

Affiliations

Light-evoked excitatory and inhibitory synaptic inputs to ON and OFF alpha ganglion cells in the mouse retina

Ji-Jie Pang et al. J Neurosci. .

Abstract

Bipolar cell and amacrine cell synaptic inputs to alpha ganglion cells (alphaGCs) in dark-adapted mouse retinas were studied by recording the light-evoked excitatory cation current (DeltaIC) and inhibitory chloride current (DeltaICl) under voltage-clamp conditions, and the cell morphology was revealed by Lucifer yellow fluorescence with a confocal microscope. Three types of alphaGCs were identified. (1) ONalphaGCs exhibits no spike activity in darkness, increased spikes in light, sustained inward DeltaIC, sustained outward DeltaICl of varying amplitude, and large soma (20-25 microm in diameter) with alpha-cell-like dendritic field approximately 180-350 microm stratifying near 70% of the inner plexiform layer (IPL) depth. (2) Transient OFFalphaGCs (tOFFalphaGCs) exhibit no spike activity in darkness, transient increased spikes at light offset, small sustained outward DeltaIC in light, a large transient inward DeltaIC at light offset, a sustained outward DeltaICl, and a morphology similar to the ONalphaGCs except for that their dendrites stratified near 30% of the IPL depth. (3) Sustained OFFalphaGCs exhibit maintained spike activity of 5-10 Hz in darkness, sustained decrease of spikes in light, sustained outward DeltaIC, sustained outward DeltaICl, and a morphology similar to the tOFFalphaGCs. By comparing the response thresholds and dynamic ranges of alphaGCs with those of the preganglion cells, our data suggest that the light responses of each type of alphaGCs are mediated by different sets of bipolar cells and amacrine cells. This detailed physiological analysis complements the existing anatomical results and provides new insights on the functional roles of individual synapses in the inner mammalian retina.


Figures
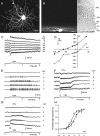
Figure 1.
Figure 1.
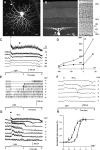
ONαGC. A, Stacked confocal fluorescent image in the flat-mount retina; B, image of the same cell in the vertical retinal section. Scale bars, 20 μm. PRL, Photoreceptor layer; OPL, outer plexiform layer; INL, inner nuclear layer; GCL, ganglion cell layer. C, Light-evoked current responses to a 2.5 sec light step (500 nm; -3 = 700 Rh*rod-1sec-1) at various holding potentials. D, Current–voltage relationships of the early (○) and late (•) component of the light responses. Spike activities (E), light-evoked excitatory cation current (ΔIC) recorded at ECl (F), and light-evoked inhibitory chloride current (ΔICl) recorded at EC to 500 nm light steps (2.5 sec) of various intensities (G). H, Response–intensity relationships of the light-evoked cation and chloride currents [ΔIC–Log I (○) and ΔICl–Log I (•)]. The average dynamic range for ΔIC is 4.9 log units and that for ΔICl is 5.3 log units.
Figure 2.
Figure 2.
ΔICl amplitude and ONαGC responses. A, Histogram of ΔICl amplitude of 23 ONαGCs; B, light-evoked current responses of an ONαGC (whose ΔICl peak amplitude was 3 pA) to a 2.5 sec light step (500 nm; -3 = 700 Rh*rod-1sec-1) at various holding potentials; C, the spike responses to 500 nm, 2.5 sec light steps of various intensities of the same cell.
Figure 3.
Figure 3.
tOFFαGC. A, Stacked confocal fluorescent image in the flat-mount retina; B, image of the same cell in the vertical retinal section. Scale bars, 20 μm. PRL, Photoreceptor layer; OPL, outer plexiform layer; INL, inner nuclear layer; GCL, ganglion cell layer. C, Light-evoked current responses to a 2.5 sec light step (500 nm; -2 = 7000 Rh*rod-1sec-1) at various holding potentials; D, current–voltage relationships of the ON (○) and OFF (•) responses. Spike activities (E), light-evoked excitatory cation current (ΔIC) recorded at ECl (F), and light-evoked inhibitory chloride current (ΔICl) recorded at EC to 500 nm light steps (2.5 sec) of various intensities (G). H, Response–intensity relationships of the light-evoked cation and chloride currents [ON ΔIC–Log I (○), OFF ΔIC–Log I (•), and ON ΔICl–Log I (▴)]. The average dynamic range for ON ΔIC is 3.9 log units, that for the OFF ΔIC is 1.6 log units, and that for ΔICl is 3.3 log units.
Figure 4.
Figure 4.
sOFFαGC. A, Stacked confocal fluorescent image in the flat-mount retina; B, image of the same cell in the vertical retinal section. Scale bars, 20 μm. PRL, Photoreceptor layer; OPL, outer plexiform layer; INL, inner nuclear layer; GCL, ganglion cell layer. C, Light-evoked current responses to a 2.5 sec light step (500 nm; -2 = 7000 Rh*rod-1sec-1) at various holding potentials; D, current–voltage relationships of the peak (○) and steady-state component (•) of the light responses. Spike activities (E), light-evoked excitatory cation current (ΔIC) recorded at ECl (F), and light-evoked inhibitory chloride current (ΔICl) recorded at EC to 500 nm light steps (2.5 sec) of various intensities (G). H, Response–intensity relationships of the light-evoked peak cation and chloride currents [ΔIC–Log I (○) and ΔICl–Log I (•). The average dynamic range for ΔIC is 3.0 log units, and that for ΔICl is 5.9 log units.
Figure 5.
Figure 5.
Synaptic circuit diagram of the ONαGCs, tOFFαGCs, and sOFFαGCs in the mouse retina. R, Rods; C(M/s), M-pigment-dominated cones; C(S/m), S-pigment-dominated cones; DBCR, rod depolarizing bipolar cell; DBCMC, M-cone-dominated depolarizing bipolar cell; HBCMC, M-cone-dominated hyperpolarizing bipolar cell; HBCSC, S-cone-dominated bipolar cells; AII, AII amacrine cells; ACM1, amacrine cell with mixed rod–cone inputs in the ON αGC pathway; ACM2, amacrine cell with mixed rod–cone inputs in the OFFαGC pathway; arrows, chemical synapses (red, glutamatergic; blue, GABAergic/glycinergic; + sign, preserving; and - sign, inverting); formula image (red), electrical synapses; PRL, photoreceptor layer; OPL, outer plexiform layer; INL, inner nuclear layer; IPL, inner plexiform layer (a, sublamina a; b, sublamina b); GCL, ganglion cell layer.

Similar articles

Cited by

References

    1. Applebury ML, Antoch MP, Baxter LC, Chun LL, Falk JD, Farhangfar F, Kage K, Krzystolik MG, Lyass LA, Robbins JT ( 2000) The murine cone photoreceptor: a single cone type expresses both S and M opsins with retinal spatial patterning. Neuron 27: 513–523. - PubMed
    1. Baylor DA ( 1987) Photoreceptor signals and vision. Proctor lecture [review]. Invest Ophthal Vis Sci 28: 34–49. - PubMed
    1. Berntson A, Taylor WR ( 2000) Response characteristics and receptive field widths of on-bipolar cells in the mouse retina. J Physiol (Lond) 524: 879–889. - PMC - PubMed
    1. Bloomfield SA, Dacheux RF ( 2001) Rod vision: pathways and processing in the mammalian retina. Prog Retin Eye Res 20: 351–384. - PubMed
    1. Bloomfield SA, Miller RF ( 1986) A functional organization of ON and OFF pathways in the rabbit retina. J Neurosci 6: 1–13. - PMC - PubMed

Publication types

MeSH terms

LinkOut - more resources