. 2003 Jul 9;23(14):6074-85.
doi: 10.1523/JNEUROSCI.23-14-06074.2003.

Maturation of EPSCs and intrinsic membrane properties enhances precision at a cerebellar synapse

Affiliations

Maturation of EPSCs and intrinsic membrane properties enhances precision at a cerebellar synapse

Laurence Cathala et al. J Neurosci. .

Erratum in

  • J Neurosci. 2004 Mar 3;24(9):2343

Abstract

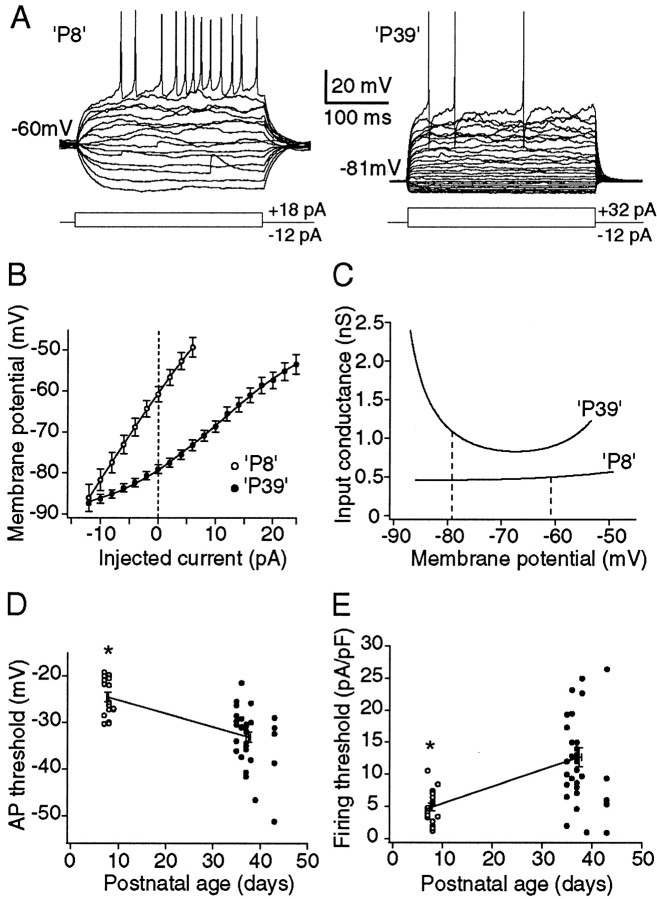
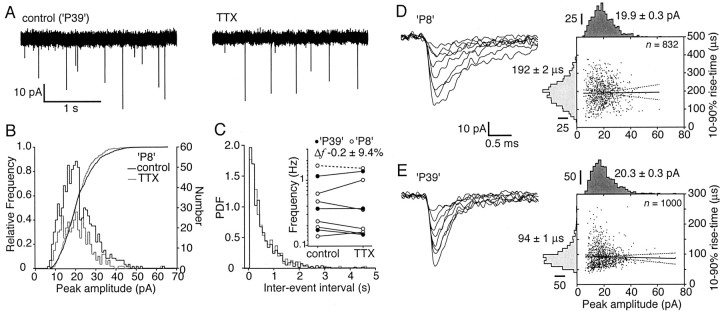
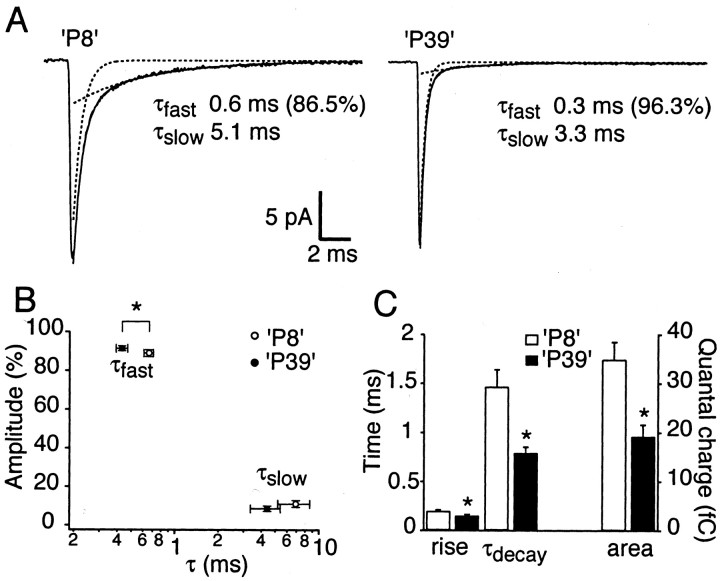
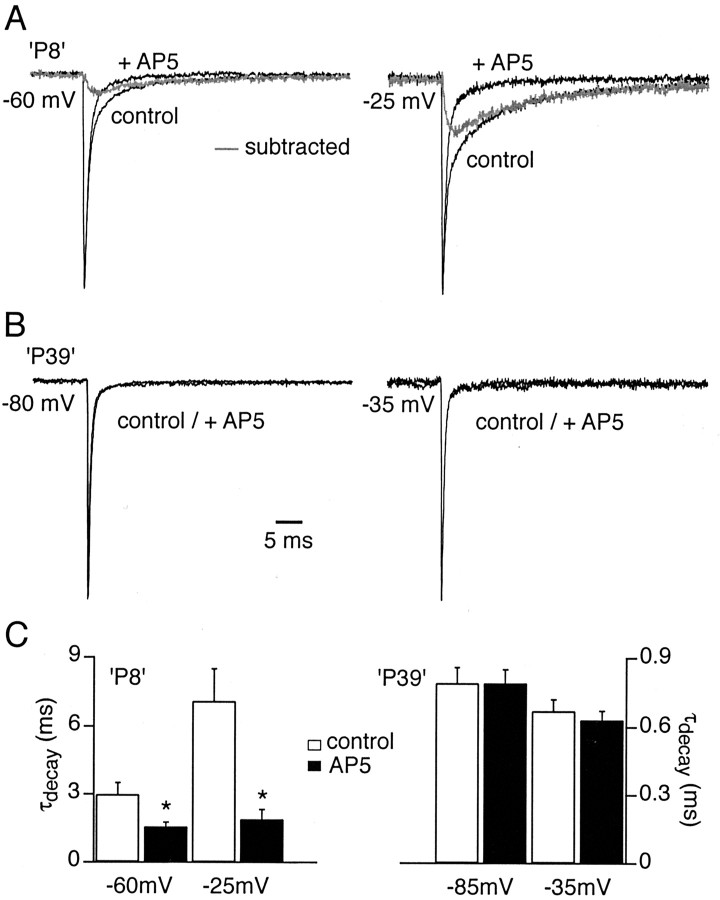
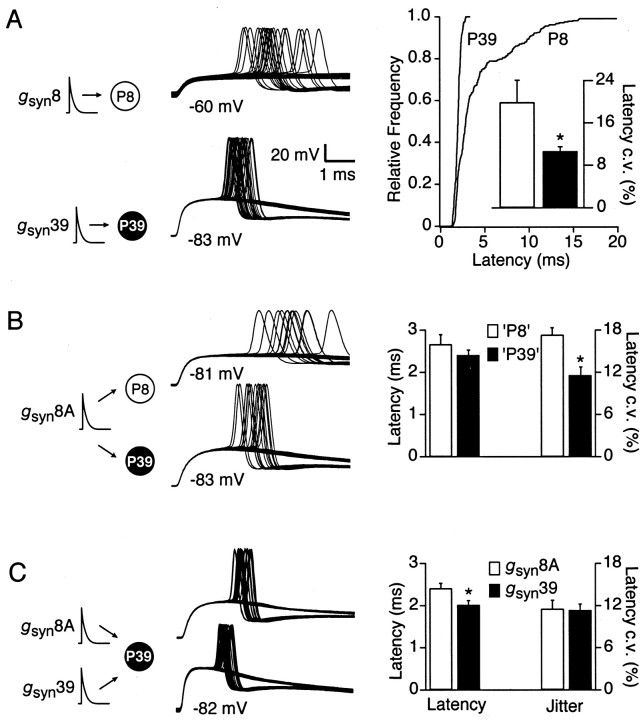
The timing of action potentials is an important determinant of information coding in the brain. The shape of the EPSP has a key influence on the temporal precision of spike generation. Here we use dynamic clamp recording and passive neuronal models to study how developmental changes in synaptic conductance waveform and intrinsic membrane properties combine to affect the EPSP and action potential generation in cerebellar granule cells. We recorded EPSCs at newly formed and mature mossy fiber-granule cell synapses. Both quantal and evoked currents showed a marked speeding of the AMPA receptor-mediated component. We also found evidence for age- and activity-dependent changes in the involvement of NMDA receptors. Although AMPA and NMDA receptors contributed to quantal EPSCs at immature synapses, multiquantal release was required to activate NMDA receptors at mature synapses, suggesting a developmental redistribution of NMDA receptors. These changes in the synaptic conductance waveform result in a faster rising EPSP and reduced spike latency in mature granule cells. Mature granule cells also have a significantly decreased input resistance, contributing to a faster decaying EPSP and a reduced spike jitter. We suggest that these concurrent developmental changes, which increase the temporal precision of EPSP-spike coupling, will increase the fidelity with which sensory information is processed within the input layer of the cerebellar cortex.


Figures

Figure 4.
Figure 4.
Intrinsic membrane properties of GCs change during development. A, Characteristic responses of immature ('P8′) and mature ('P39′) GCs (P7 and P37) to constant current injection (2 pA steps). Responses shown are only those up to the first current step that induced spiking in each cell. B, Subthreshold current–voltage relationship for P8 (n = 25) and P39 (n = 26) GCs. Vertical error bars indicate SEM. Solid lines are fitted sigmoidal curves. C, Relationship between membrane potential and input conductance for P8 and P39 GCs (first derivative of fitted lines shown in B). Dashed lines indicate the mean resting membrane potentials for these cells. D, Plot showing the developmental decrease in action potential threshold (-27.1 ± 1.4 mV, n = 17 at P8 to -36.5 ± 1.0 mV, n = 31 at P39; *p < 0.05, Mann–Whitney U test). Line connects mean values, and horizontal and vertical error bars indicate SEM. E, Equivalent plot to D, showing the developmental increase in current required to evoke action potentials (4.9 ± 0.6 pA/pF, n = 18 at P8 vs 12.7 ± 1.5 pA/pF, n = 31 at P39; *p < 0.05, Mann–Whitney U test).
Figure 1.
Figure 1.
Properties of spontaneous EPSCs in mature and immature GCs. A, Continuous records showing spontaneous EPSCs recorded from a'P39′ GC (P35) in the absence and presence of TTX (Vm = -70 mV). B, Amplitude distributions of events from a'P8′ GC (P7) recorded in the absence and presence of TTX. Superimposed lines show cumulative amplitude histograms (p > 0.05; Kolmogorov–Smirnov test). C, Interevent interval histograms from the same cell as B, showing the exponential distribution of interevent intervals and the lack of effect of TTX. Inset, Summary of results from both age groups. Dotted line indicates cell shown in Cf denotes mean change in frequency across all cells). D, Superimposed spontaneous EPSCs from a P7 GC (Vm = -70 mV). Right-hand panel shows a plot of peak amplitude against 10–90% rise time for the same cell, with superimposed distributions. E, Corresponding data for a P36 GC. In both D and E there is no correlation between peak and 10–90% rise time (p > 0.05; Spearmann rank order correlation). The solid lines show the fitted linear regressions, and the dotted lines show the 95% confidence limits.
Figure 2.
Figure 2.
Speeding of the AMPAR-mediated quantal EPSC. A, Representative averaged AMPAR–quantal EPSCs at -70 mV, from 'P8′ and 'P39′ GCs (P8 and P36). At both ages, the decay phase was best fitted by a double exponential function (solid line). The individual components of the fit are shown as dotted lines. B, For each age group the mean decay time constants (τfast and τslow) are plotted against their relative contributions to the EPSC amplitudes. Error bars indicate SEM. At P8, τfast = 0.66 ± 0.05 msec (88.9 ± 1.8%) and τslow = 6.91 ± 1.71 msec; at P39,τfast = 0.59 ± 0.04 msec (91.4 ± 1.3%) andτslow = 4.38 ± 1.02 msec. Asterisk indicates significant difference between τfast values (Mann–Whitney U test). C, Histogram of spontaneous EPSC 10–90% rise, τdecay, and quantal charge in both age groups. Asterisks indicate significant difference between groups (rise andτdecay, t test; quantal charge, Mann–Whitney U test).
Figure 3.
Figure 3.
Developmental change in NMDAR contribution to quantal EPSCs. A, Scaled population average EPSCs recorded from P8 GCs (n = 5). Recordings were made at two potentials: resting potential (-60 mV) and action potential threshold (-25 mV) (Fig. 4). B, Population average EPSCs from P39 GCs at the corresponding potentials (n = 9 at -80 mV and n = 7 at -35 mV). Calibration applies to both A and B. The term +AP5 denotes addition of both AP5 and 7-CK. C, Histogram showing the effect of NMDAR blockade on theτdecay of the EPSCs. Note the significant effect in immature GCs (*p < 0.05) and the lack of effect in mature GCs (note also the 10-fold change in scale on the ordinate).
Figure 5.
Figure 5.
Effect of GC morphology on EPSP properties. A, Z-projections of confocal images from neurobiotin-filled P8 and P39 GCs (P9 and P38) in sagittal cerebellar slices. For the P8 GC, note the numerous dendrites and the fine axon extending into the molecular layer. For the P39 GC, note the four dendrites, each of which terminates in dendritic digits. Scale bars, 10 μm. ML, Molecular layer; PL, Purkinje cell layer; IGL, internal granule cell layer. B, Shape plots of the two GCs reconstructed in NEURON. C, Plots showing the placement of the conductance injection in each simulation. In each case arrowhead 1 indicates the soma (gray). Calibration applies to B and C. D, Somatic EPSPs recorded in response to excitation at somatic and dendritic locations, as indicated. Arrowheads (sequentially numbered according to decreasing peak amplitude; 1–5 for P9 and 1–3 for P39) indicate EPSPs originating from the corresponding sites shown in C.
Figure 6.
Figure 6.
AMPAR–EPSPs evoked by conductance injection. A, Representative responses of 'P8′ and 'P39′ GCs (P7 and P37) to injection of synaptic conductance waveforms (gsyn8A and gsyn39). For these cells, the P8 EPSP had a peak amplitude of 4.0 mV, a 10–90% rise-time of 0.99 msec, and half-width of 13.2 msec; the P39 EPSP had a peak amplitude of 2.6 mV, a 10–90% rise of 0.43 msec, and half-width of 4.3 msec. B, Mean responses (±SEM, dotted lines) of P8 (n = 8) and P39 GCs (n = 15) to gsyn8A or gsyn39 at -80 mV. The right-hand panel shows a histogram of EPSP peak amplitude, 10–90% rise-time, and half-width at the two ages. P39 EPSPs were significantly smaller and faster then P8 EPSPs. C, Mean responses of P39 GCs to injection of gsyn 8A and gsyn 39(both n = 8). Changing gsyn affects only the amplitude and the rise of the EPSP. D, Mean responses of P8 and P39 GCs to gsyn 39 (both n = 8). The different intrinsic properties of the two GCs affect only the rise and decay of the EPSP.
Figure 7.
Figure 7.
Effect of NMDARs on EPSPs evoked by conductance injection. A, Representative responses of P8 GCs (P8) to injection of synaptic conductance waveforms (gsyn8A and gsyn8) at -60 mV. The gsyn8A-induced EPSP had a peak amplitude of 4.6 mV, a 10–90% rise time of 2.34 msec, and half-width of 21.9 msec. The gsyn8-induced EPSP had a peak amplitude of 3.2 mV, a 10–90% rise time of 0.82 msec, and half-width of 8.2 msec. B, EPSPs from single-compartment passive NEURON models of P8 and P39 GCs, evoked using gsyn8 or gsyn39. Model parameters were chosen to match properties of P8 GCs [diameter 12.7 μm to give Cin = 4.0 pF; specific membrane conductance (Gm) 1.56e -4 S/cm 2 to give Gin = 0.52 nS] and P39 GCs (diameter 10.3 μm to give Cin = 3.0 pF; Gm 4.42e -4 S/cm 2 to give Gin = 1.47 nS). The right-hand panel shows a histogram of EPSP peak amplitude, 10–90% rise time, and half-width at the two ages. P39 EPSPs were significantly smaller and faster than P8 EPSPs. For comparison, the dashed lines in the P8 (open bars) indicate the results obtained with the AMPAR-mediated component alone. C, Responses from modeled P39 GCs to injection of gsyn8 and gsyn39. Changing gsyn affects the amplitude, the rise, and the decay of the EPSP. D, Responses of modeled P8 and P39 GCs to gsyn8. The different intrinsic properties of the two GCs affect only the rise and decay of the EPSP. Voltage and time calibrations in A also apply to BD.
Figure 8.
Figure 8.
Action potential-evoked EPSCs and simulated EPSPs accelerate with age. A, Population average EPSCs recorded from P8 and P39 GCs at +40 mV (n = 5 and 4). The NMDAR-mediated component was determined by subtraction of the current (AMPA) recorded in AP5. B, Scaled multi-exponential fits of the evoked EPSCs shown in A. C, Conductance waveforms with the NMDAR-mediated component scaled for the appropriate resting potential. Right panels show simulated EPSPs from single-compartment passive NEURON models (details as in Fig. 7). D, Scaled conductance waveforms and corresponding dual-component EPSPs on expanded time scales.
Figure 9.
Figure 9.
Developmental changes in EPSP–spike coupling. A, Representative examples of spikes induced in 'P8′ and 'P39′ GCs (P9 and P35) from their resting potentials, by the injection of multiple quanta. In each cell, by varying the number of quanta injected, the spiking probability was set close to 0.5 and was not significantly different between each test group. In the examples shown, spiking probability was 0.56 at P8 and 0.68 at P39. The right-hand panels summarize the spike latency and mean spike jitter (n = 9 at P8 and P39). The cumulative distributions of latency contain pooled data from all cells (an equal number of events from each cell) and are significantly different (p < 0.05; Kolmogorov–Smirnov test). In the histogram of spike jitter (Latency c.v.), the vertical error bars indicate SEM; *p < 0.05. B, Representative examples of spikes induced by gsyn8A injected into P8 and P39 GCs at their resting potentials. The right-hand panel shows a histogram of mean latency and jitter (n = 8 for P8 and 6 for P39). Error bars indicate SEM; *p < 0.05. The relatively hyperpolarized resting potential of the P8 cell shown reflects the spread of the data, and at this age there was no correlation between resting potential and spike latency (p = 0.52; Spearman rank order correlation) or spike jitter (p = 0.43). C, Representative examples of spikes induced by gsyn8A and gsyn39 injected into a single P39 cell. The right-hand panel shows a histogram of mean latency and jitter (n = 6).

Similar articles

Cited by

References

    1. Akazawa C, Shigemoto R, Bessho Y, Nakanishi S, Mizuno N ( 1994) Differential expression of five N-methyl-d-aspartate receptor subunit mRNAs in the cerebellum of developing and adult rats. J Comp Neurol 347: 150–160. - PubMed
    1. Baude A, Molnar E, Latawiec D, McIlhinney RA, Somogyi P ( 1994) Synaptic and nonsynaptic localization of the GluR1 subunit of the AMPA-type excitatory amino acid receptor in the rat cerebellum. J Neurosci 14: 2830–2843. - PMC - PubMed
    1. Bekkers JM, Stevens CF ( 1989) NMDA and non-NMDA receptors are colocalized at individual excitatory synapses in cultured rat hippocampus. Nature 341: 230–233. - PubMed
    1. Brenowitz S, Trussell LO ( 2001) Maturation of synaptic transmission at end-bulb synapses of the cochlear nucleus. J Neurosci 21: 9487–9498. - PMC - PubMed
    1. Brickley SG, Cull-Candy SG, Farrant M ( 1996) Development of a tonic form of synaptic inhibition in rat cerebellar granule cells resulting from persistent activation of GABAA receptors. J Physiol (Lond) 497: 753–759. - PMC - PubMed

Publication types

MeSH terms

Substances

LinkOut - more resources