. 2003 Jul 9;23(14):6086-95.
doi: 10.1523/JNEUROSCI.23-14-06086.2003.

Presynaptic depression of glutamatergic synaptic transmission by D1-like dopamine receptor activation in the avian basal ganglia

Affiliations

Presynaptic depression of glutamatergic synaptic transmission by D1-like dopamine receptor activation in the avian basal ganglia

Long Ding et al. J Neurosci. .

Abstract

Vocal behavior in songbirds exemplifies a rich integration of motor, cognitive, and social functions that are shared among vertebrates. As a part of the underlying neural substrate, the song system, the anterior forebrain pathway (AFP) is required for song learning and maintenance. The AFP resembles the mammalian basal ganglia-thalamocortical loop in its macroscopic organization, neuronal intrinsic properties, and microcircuitry. Area X, the first station in the AFP, is a part of the basal ganglia essential for vocal learning. It receives glutamatergic inputs from pallial structures and sends GABAergic outputs to thalamic structures. It also receives dense dopaminergic innervation from the midbrain. The role of this innervation is essentially unknown. Here we provide evidence that dopamine (DA) can modulate the glutamatergic inputs to spiny neurons in area X. In whole-cell voltage-clamp recordings from neurons in brain slices of adult zebra finches, we found that activation of D1-like DA receptors depresses ionotropic glutamatergic synaptic current in area X spiny neurons. This effect is mediated by a presynaptic site of action, mimicked by activation of adenylyl cyclase, and blocked by protein kinase A inhibitor and an adenosine A1 receptor antagonist. These results suggest that, in addition to altering the input-output function of spiny neurons by modulating their excitability, as we have shown previously, DA can directly influence the excitatory inputs to these neurons as well. Thus, DA can exert fine control over information processing through spiny neurons in area X, the dynamics of the AFP output, and ultimately song learning and maintenance.


Figures

Figure 1.
Figure 1.
A simplified diagram of the oscine song system. The song system consists of three major pathways. The nucleus interfacialis (NIf) likely provides key auditory input to the song system. The motor pathway starts with nucleus HVC (used as a proper name). HVC projects to the robust nucleus of archistriatum (RA), which innervates several brainstem nuclei controlling respiration and vocalization. The anterior forebrain pathway starts with the projection from HVC to area X, a part of the avian basal ganglia within the lobus parolfactorius (LPO). Area X projects to the medial portion of the dorsolateral nucleus of the anterior thalamus (DLM), which sends its output to the lateral magnocellular nucleus of the anterior neostriatum (LMAN), which projects to RA and sends collaterals to area X. Area X thus receives glutamatergic inputs from HVC and LMAN. It also receives dense dopaminergic inputs from the ventral area of Tsai (AVT). The gray area represents the paleostriatal complex.
Figure 2.
Figure 2.
Classification of spiny versus nonspiny neurons in area X. A1, A micrograph of a spiny neuron recovered histologically after recording. Scale bar, 20 μm. A2, A spiny dendrite of the same cell viewed at higher magnification. Scale bar, 10 μm. A3, The response of this cell to the standard voltage ramp. Note the prominent double-peaked inward current. Calibration:vertical 500 pA, horizontal 100 msec. B1, A micrograph of a nonspiny neuron; same scale as A1. Note the larger soma and different shape of dendritic branches, compared with A1. B2, The dendrite of this cell is beady but not spiny; same scale as A2. B3, The ramp response. Note the large outward current after the early inward peak. Calibration: vertical 500 pA, horizontal 100 msec. C, Scatter-plot of the initial resting potential and ramp index calculated from the ramp response. Filled circles represent cells used in this paper; filled triangles represent cells that were spontaneously active before patching; open circles represent other cells recorded. Note the two distinct clusters and the large proportion of cells in the left cluster. D, Scatter-plot of the soma diameter and ramp index from all cells reconstructed histologically.
Figure 3.
Figure 3.
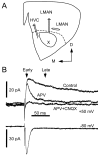
A, Illustration of a coronal section through area X and placement of stimulating electrodes. B, Pharmacological and temporal isolation of NMDA and non-NMDA receptor-mediated EPSCs. EPSCs were evoked at holding potentials of +50 and -80 mV. Arrows indicate the time points when early and late components of the EPSC were measured.
Figure 9.
Figure 9.
Forskolin does not reduce postsynaptic NMDA receptor function. A, Direct pressure application of NMDA (2 mm) induced voltage-sensitive current responses (puff response) in a spiny neuron. Note the reversal potential at approximately +20 mV. B, In the same cell shown in A, the current–voltage plot of the puff response showed voltage dependence similar to that of the late component of the EPSC evoked with electrical stimulation. C, Summary plot of the change in the puff response and the late component of the EPSC by forskolin application. Filled symbols represent two cells where puffs and electrical stimulation were interleaved, one of which is shown in D. D1, Forskolin reduced the EPSC but not the puff response in a spiny neuron. Subsequent application of APV blocked both the late component of EPSC and the puff response. D2, Example traces of the EPSC. D3, Example traces of the puff response. Holding potential was +40 mV.
Figure 4.
Figure 4.
SKF-38393 (10 μm) reduces ionotropic glutamatergic synaptic responses in spiny neurons via activation of D1-like DA receptors. A1, SKF-38393 reduced the amplitude of the non-NMDA receptor-mediated EPSC. The numbers indicate the time when example traces in A2 were taken. A2, Example traces. Holding potential was -80 mV. B1, SKF-38393 reversibly reduced the size of the late component of the EPSC, which is mediated by NMDA receptors. B2, Example traces. Holding potential was +70 mV. C, SCH-23390 (10–20 μm) blocked the effect of SKF-38393, as shown in the summary plot of SKF-38393-induced percentage change in EPSC size. Open circles represent non-NMDA receptor-mediated component measured at a holding potential of -80 mV; filled circles represent NMDA receptor-mediated component measured at positive holding potentials +30 ∼ +70 mV; open squares represent NMDA receptor-mediated component measured at positive holding potentials in the presence of SCH-23390; filled diamonds represent NMDA receptor-mediated component measured at positive holding potentials in the presence of sulpiride (10 μm). Horizontal lines indicate median values.
Figure 5.
Figure 5.
Forskolin (FSK; 10 μm) mimics the synaptic depression induced by SKF-38393. A1, FSK reversibly reduced the amplitude of the non-NMDA receptor-mediated EPSC. The numbers indicate the time when example traces in A2 were taken. A2, Example traces. Holding potential was -80 mV. B1, FSK reversibly reduced the size of the NMDA receptor-mediated late component of the EPSC. B2, Example traces. Holding potential was +40 mV. C, A similar depressing effect of FSK was observed at various holding potentials, as shown in the summary plot of FSK-induced percentage change in EPSC size. Open circles represent non-NMDA receptor-mediated component measured at a holding potential of -80 mV; filled triangles represent NMDA receptor-mediated component measured at negative holding potentials between -40 and -20 mV; filled circles represent NMDA receptor-mediated component measured at positive holding potentials between +35 and +70 mV.
Figure 6.
Figure 6.
The effects of SKF-38393 and forskolin are both mediated by the adenylyl cyclase–PKA pathway. A1, 1,9-dideoxyforskolin (DDF) failed to reduce the size of the NMDA receptor-mediated late component of the EPSC, but forskolin (FSK) did reduce this component. The numbers indicate the time when example traces in A2 were taken. A2, Example traces. Holding potential was +40 mV. B, Bath-applied Rp-cAMPS (10 μm) blocked the effect of forskolin. Each symbol represents the mean ± SEM of late EPSC size in a2 min window normalized to the value before forskolin application. All data are from the same cell. Filled circles represent forskolin application in the absence of Rp-cAMPS; open squares represent subsequent forskolin application in the presence of Rp-cAMPS after a 10 min preincubation in Rp-cAMPS. C1, Bath-applied Rp-cAMPS (10 μm) blocked the effect of SKF-38393. The numbers indicate the time when example traces in C2 were taken. C2, Example traces. Holding potential was +40 mV. D, Summary plot of forskolin or SKF-38393-induced change in late EPSC size measured at positive holding potentials between +30 and +70 mV.
Figure 7.
Figure 7.
Paired-pulse ratio and coefficient of variation of EPSC amplitude increased in the presence of forskolin (A, B) and SKF-38393 (C, D). A, C, Scatter-plot of paired-pulse ratios before and during forskolin and SKF-38393 application, respectively. Filled circles represent values measured from late EPSC size at positive holding potentials; filled triangles represent values from late EPSC size at negative holding potentials; open circles represent values from EPSC amplitude at -80 mV; dashed line represents a line with a slope of 1. Note that most data points lie above the line, indicating an increase in paired-pulse ratio in the presence of forskolin/SKF-38393. B, D, Scatter-plot of coefficients of variation before and during forskolin and SKF-38393 application, respectively. Note that most data points lie above the line.
Figure 8.
Figure 8.
Intracellularly applied Rp-cAMPS (100–400 μm) does not block the effects of forskolin and SKF-38393. A1, Forskolin reduced the late EPSC size in the presence of intracellular Rp-cAMPS. A2, Example traces. Holding potential was +40 mV. B, Summary plot of change induced by forskolin. Rp-In, Forskolin application in the presence of intracellularly applied Rp-cAMPS; Rp-Ex, forskolin application in the presence of bath-applied Rp-cAMPS. C1, In the same cell as in A, SKF-38393 also reduced the late EPSC size in the presence of intracellular Rp-cAMPS. C2, Example traces. Holding potential was +40 mV. D, Summary plot of percentage change induced by SKF-38393. Horizontal lines indicate median values.
Figure 10.
Figure 10.
A, The adenosine A1 receptor antagonist DPCPX (500 nm) blocked forskolin-induced synaptic depression. Inset, Example traces of EPSCs. Holding potential was -80 mV. B, Summary plot of the change in EPSC size by forskolin application in the presence of CGP35348 (CGP; 500 μm), AM251 (AM; 4–5 μm), or DPCPX (500 nm). Data points labeled “NMDA” and “CGP” were measured from the late component of EPSCs at positive holding potentials, whereas the others were from EPSC sizes recorded at a holding potential of -80 mV.
Figure 11.
Figure 11.
In a subset of neurons, forskolin induced delayed potentiation in the NMDA receptor-mediated EPSC. In 3 of 11 cells, the late EPSC size increased ∼20 min after forskolin was washed out of the bath. Lines connect data points measured from the same cells.
Figure 12.
Figure 12.
Hypothesized mechanism underlying the D1-like DA receptor-mediated presynaptic depression. A, Adenosine; AC, adenylyl cyclase; AR, adenosine receptor; D1R, D1-like DA receptors. Solid lines indicate activation. Dashed lines indicate release/diffusion/binding. See Discussion for more details.

Similar articles

Cited by

References

    1. Blanton MG, Lo Turco JJ, Kriegstein AR ( 1989) Whole cell recording from neurons in slices of reptilian and mammalian cerebral cortex. J Neurosci Methods 30: 203–210. - PubMed
    1. Bonci A, Williams JT ( 1996) A common mechanism mediates long-term changes in synaptic transmission after chronic cocaine and morphine. Neuron 16: 631–639. - PubMed
    1. Bottjer SW ( 1993) The distribution of tyrosine hydroxylase immunoreactivity in the brains of male and female zebra finches. J Neurobiol 24: 51–69. - PubMed
    1. Bottjer SW, Johnson F ( 1997) Circuits, hormones, and learning: vocal behavior in songbirds. J Neurobiol 33: 602–618. - PubMed
    1. Bottjer SW, Miesner EA, Arnold AP ( 1984) Forebrain lesions disrupt development but not maintenance of song in passerine birds. Science 224: 901–903. - PubMed

Publication types

MeSH terms

LinkOut - more resources