

Assessing functional divergence in EF-1alpha and its paralogs in eukaryotes and archaebacteria
- PMID: 12853641
- PMCID: PMC165955
- DOI: 10.1093/nar/gkg440
Assessing functional divergence in EF-1alpha and its paralogs in eukaryotes and archaebacteria
Abstract
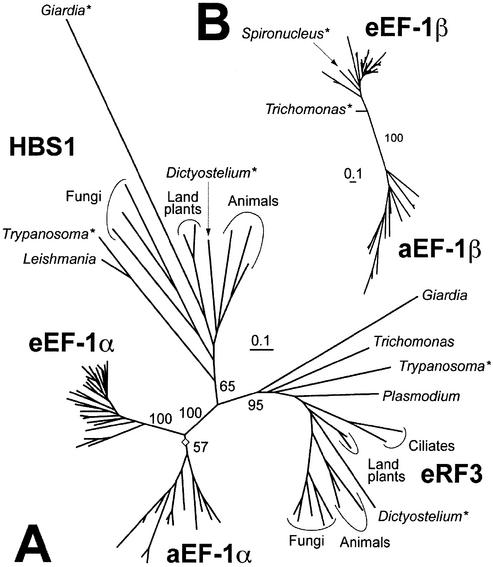
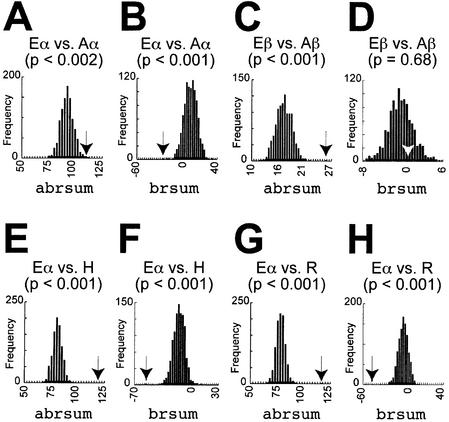
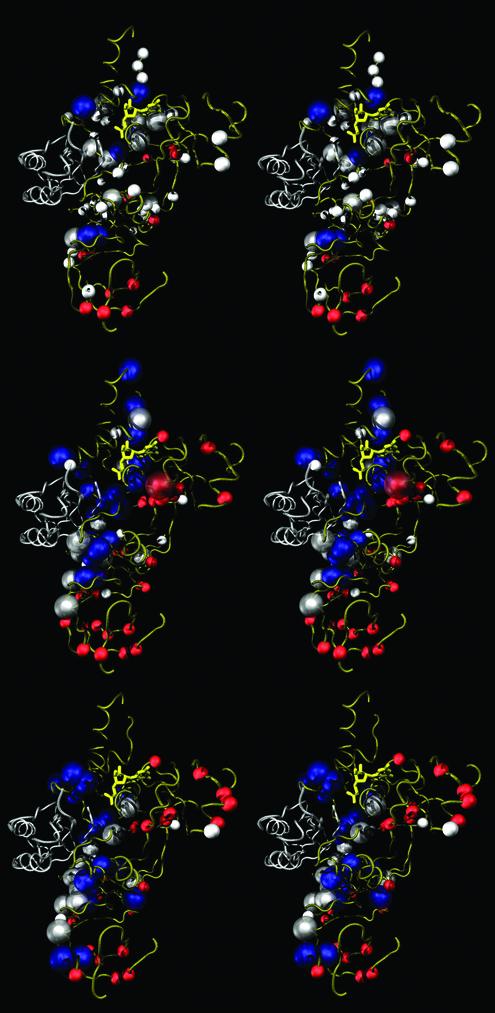
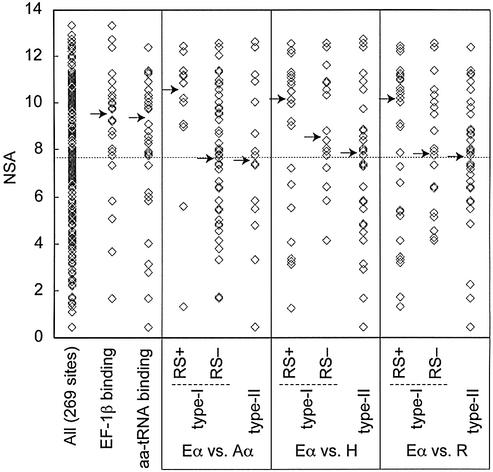
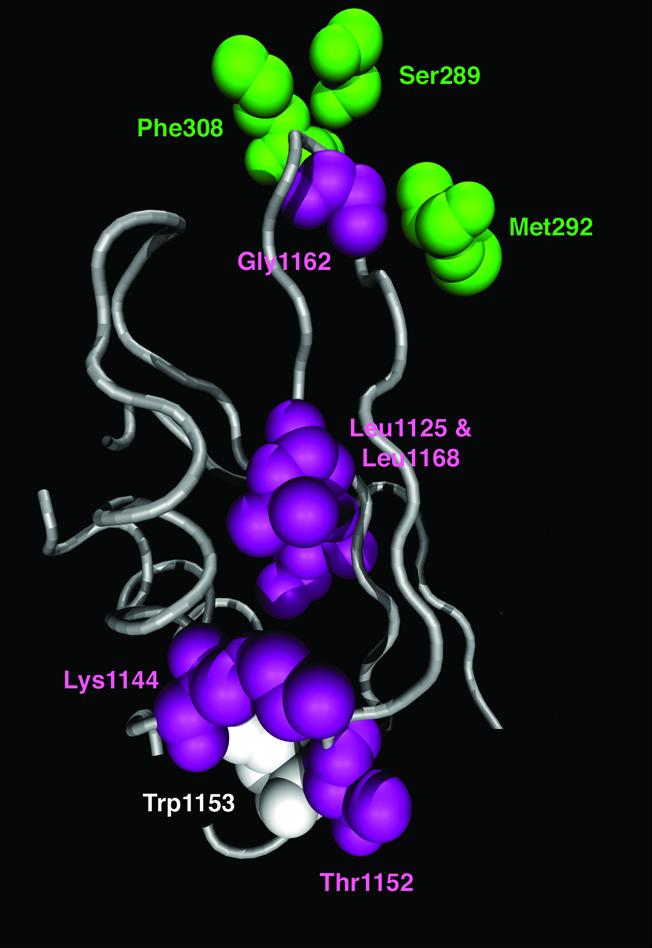
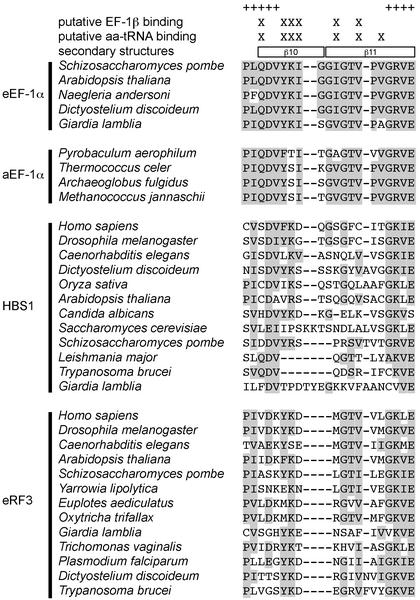
A number of methods have recently been published that use phylogenetic information extracted from large multiple sequence alignments to detect sites that have changed properties in related protein families. In this study we use such methods to assess functional divergence between eukaryotic EF-1alpha (eEF-1alpha), archaebacterial EF-1alpha (aEF-1alpha) and two eukaryote-specific EF-1alpha paralogs-eukaryotic release factor 3 (eRF3) and Hsp70 subfamily B suppressor 1 (HBS1). Overall, the evolutionary modes of aEF-1alpha, HBS1 and eRF3 appear to significantly differ from that of eEF-1alpha. However, functionally divergent (FD) sites detected between aEF-1alpha and eEF-1alpha only weakly overlap with sites implicated as putative EF-1beta or aminoacyl-tRNA (aa-tRNA) binding residues in EF-1alpha, as expected based on the shared ancestral primary translational functions of these two orthologs. In contrast, FD sites detected between eEF-1alpha and its paralogs significantly overlap with the putative EF-1beta and/or aa-tRNA binding sites in EF-1alpha. In eRF3 and HBS1, these sites appear to be released from functional constraints, indicating that they bind neither eEF-1beta nor aa-tRNA. These results are consistent with experimental observations that eRF3 does not bind to aa-tRNA, but do not support the 'EF-1alpha-like' function recently proposed for HBS1. We re-assess the available genetic data for HBS1 in light of our analyses, and propose that this protein may function in stop codon-independent peptide release.
Figures
References
-
- Fitch W.M. and Markowitz,E. (1970) An improved method for determining codon variability in a gene and its application to the rate of fixation of mutations in evolution. Biochem. Genet., 4, 579–593. - PubMed
-
- Galtier N. (2001) Maximum-likelihood phylogenetic analysis under a covarion-like model. Mol. Biol. Evol., 18, 866–873. - PubMed
-
- Penny D. and Hasegawa,M. (2001) Covarion model of molecular evolution. In Brenner,S. and Miller,J.H. (eds), Encyclopedia of Genetics. Academic Press, San Diego, pp. 473–477.
-
- Yang Z. (1996) Among-site rate variation and its impact on phylogenetic analyses. Trends Ecol. Evol., 11, 367–372. - PubMed
-
- Huelsenbeck J.P. (2002) Testing a covariotide model of DNA substitution. Mol. Biol. Evol., 19, 698–707. - PubMed
Publication types
MeSH terms
Substances
Associated data
- Actions
- Actions
- Actions
- Actions
- Actions
- Actions
- Actions
- Actions
Grants and funding
LinkOut - more resources
Full Text Sources
Molecular Biology Databases
Research Materials
