

Endocardial versus epicardial electrical synchrony during LV free-wall pacing
- PMID: 12855422
- PMCID: PMC2396262
- DOI: 10.1152/ajpheart.00282.2003
Endocardial versus epicardial electrical synchrony during LV free-wall pacing
Abstract
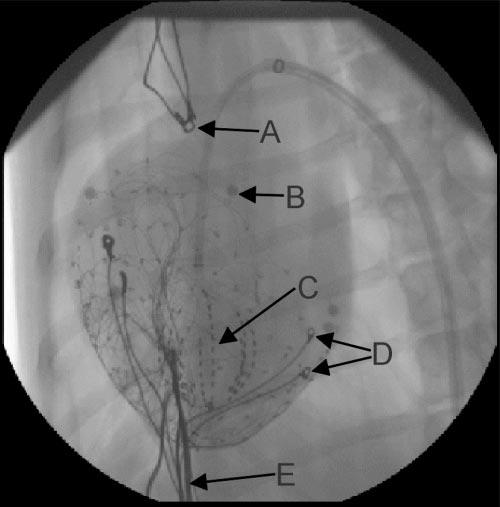
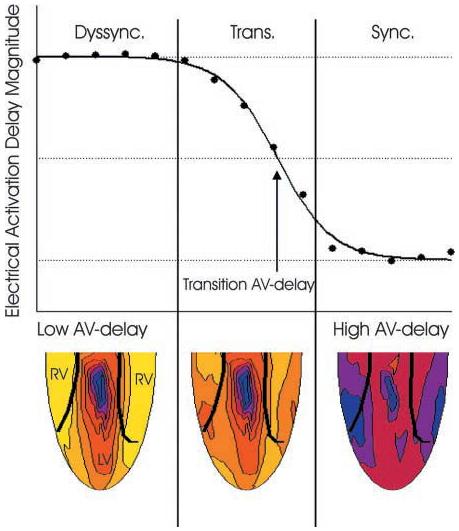
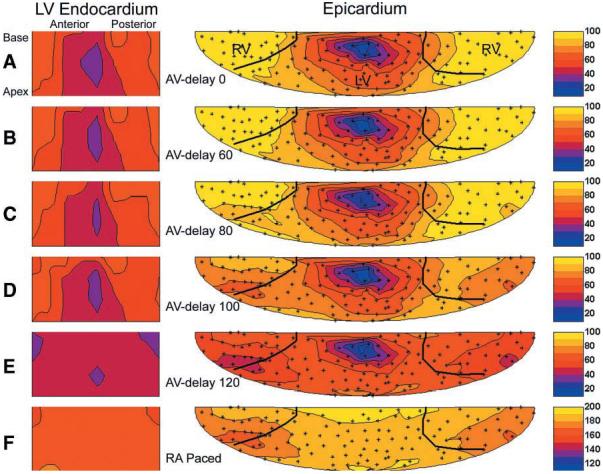
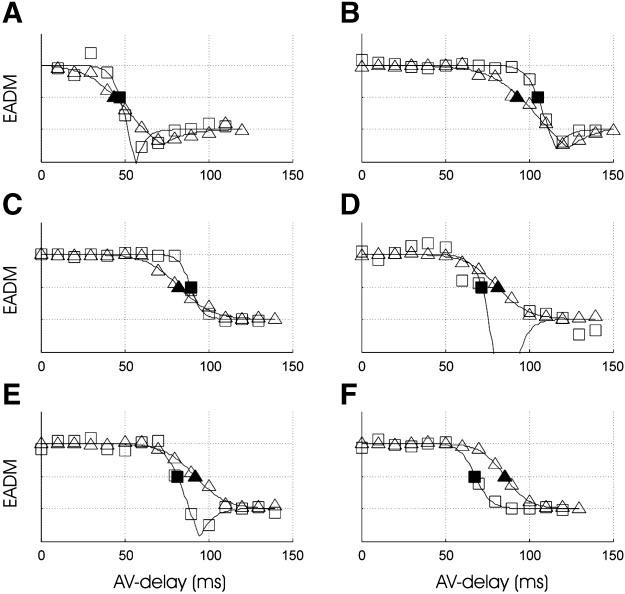
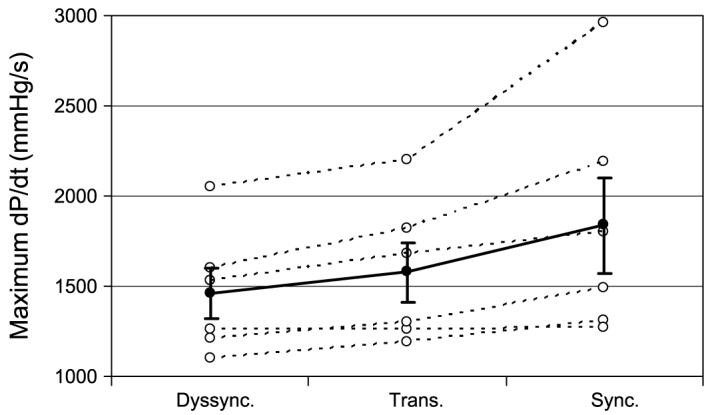
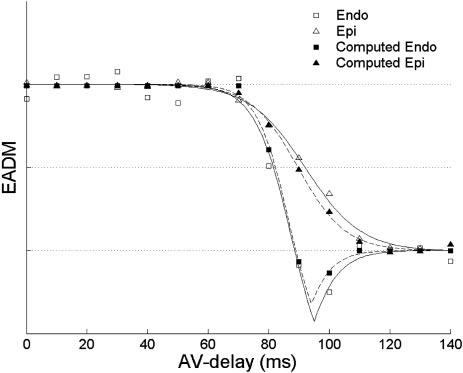
Cardiac resynchronization therapy has been most typically achieved by biventricular stimulation. However, left ventricular (LV) free-wall pacing appears equally effective in acute and chronic clinical studies. Recent data suggest electrical synchrony measured epicardially is not required to yield effective mechanical synchronization, whereas endocardial mapping data suggest synchrony (fusion with intrinsic conduction) is important. To better understand this disparity, we simultaneously mapped both endocardial and epicardial electrical activation during LV free-wall pacing at varying atrioventricular delays (AV delay 0-150 ms) in six normal dogs with the use of a 64-electrode LV endocardial basket and a 128-electrode epicardial sock. The transition from dyssynchronous LV-paced activation to synchronous RA-paced activation was studied by constructing activation time maps for both endo- and epicardial surfaces as a function of increasing AV delay. The AV delay at the transition from dyssynchronous to synchronous activation was defined as the transition delay (AVt). AVt was variable among experiments, in the range of 44-93 ms on the epicardium and 47-105 ms on the endocardium. Differences in endo- and epicardial AVt were smaller (-17 to +12 ms) and not significant on average (-5.0 +/- 5.2 ms). In no instance was the transition to synchrony complete on one surface without substantial concurrent transition on the other surface. We conclude that both epicardial and endocardial synchrony due to fusion of native with ventricular stimulation occur nearly concurrently. Assessment of electrical epicardial delay, as often used clinically during cardiac resynchronization therapy lead placement, should provide adequate assessment of stimulation delay for inner wall layers as well.
Figures
References
-
- Auricchio A, Stellbrink C, Block M, Sack S, Vogt J, Bakker P, Klein H, Kramer A, Ding J, Salo R, Tockman B, Pochet T, Spinelli J. Effect of pacing chamber and atrioventricular delay on acute systolic function of paced patients with congestive heart failure. The Pacing Therapies for Congestive Heart Failure Study Group. The Guidant Congestive Heart Failure Research Group. Circulation. 1999;99:2993–3001. - PubMed
-
- Blanc JJ, Etienne Y, Gilard M, Mansourati J, Munier S, Boschat J, Benditt DG, Lurie KG. Evaluation of different ventricular pacing sites in patients with severe heart failure: results of an acute hemodynamic study. Circulation. 1997;96:3273–3277. - PubMed
-
- Bruce E. Biomedical Signal Processing and Signal Modeling. Wiley; New York: 2001. pp. 335–336.
-
- Burkhoff D, Oikawa RY, Sagawa K. Influence of pacing site on canine left ventricular contraction. Am J Physiol Heart Circ Physiol. 1986;251:H428–H435. - PubMed
-
- Cazeau S, Leclercq C, Lavergne T, Walker S, Varma C, Linde C, Garrigue S, Kappenberger L, Haywood GA, Santini M, Bailleul C, Daubert JC. Effects of multisite biventricular pacing in patients with heart failure and intraventricular conduction delay. N Engl J Med. 2001;344:873–880. - PubMed
Publication types
MeSH terms
Grants and funding
LinkOut - more resources
Full Text Sources
Other Literature Sources