

Loci on chromosomes 2, 4, 9, and 16 for body weight, body length, and adiposity identified in a genome scan of an F2 intercross between the 129P3/J and C57BL/6ByJ mouse strains
- PMID: 12856282
- PMCID: PMC1435867
- DOI: 10.1007/s00335-002-2170-y
Loci on chromosomes 2, 4, 9, and 16 for body weight, body length, and adiposity identified in a genome scan of an F2 intercross between the 129P3/J and C57BL/6ByJ mouse strains
Abstract
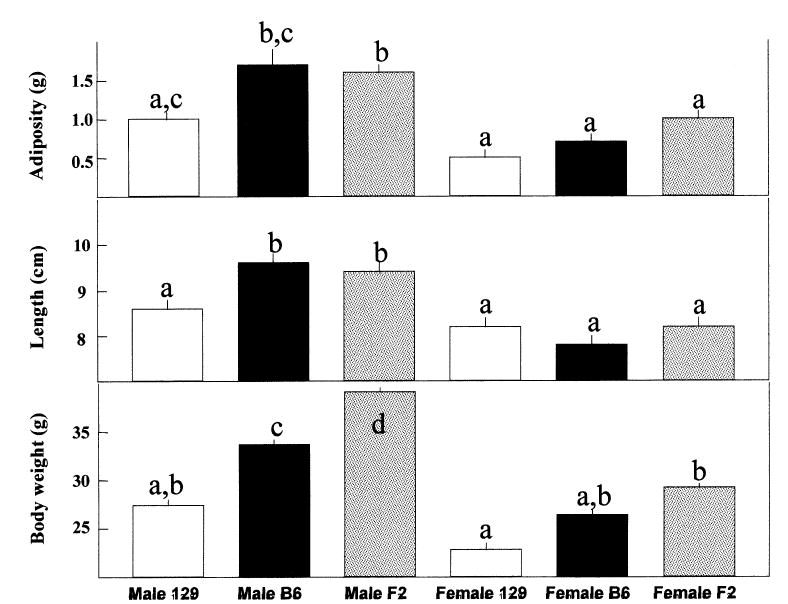
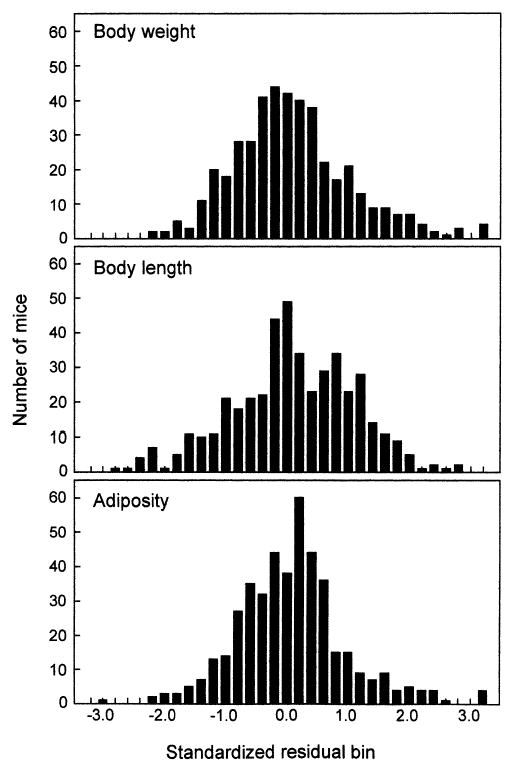
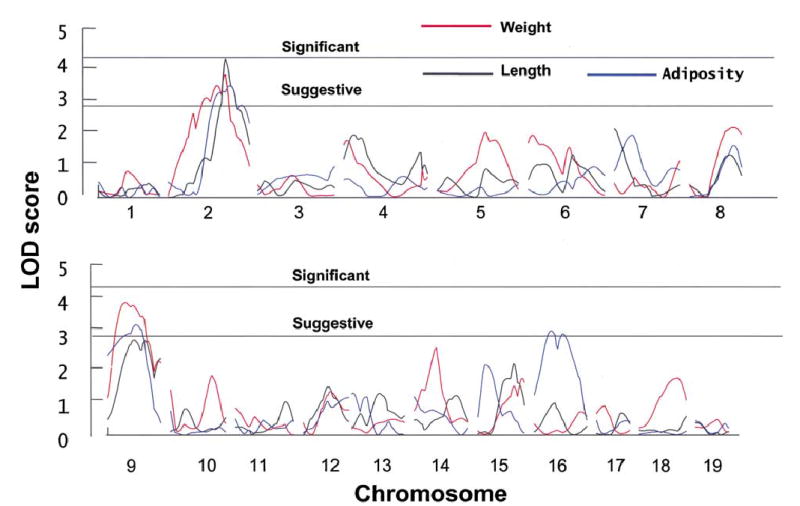
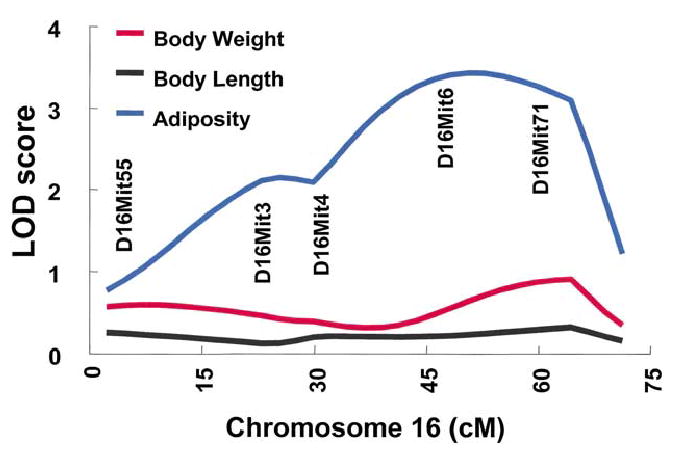
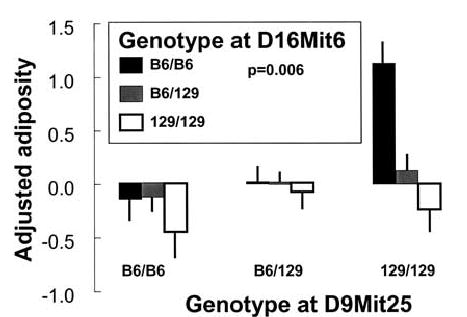
Mice have proved to be a powerful model organism for understanding obesity in humans. Single gene mutants and genetically modified mice have been used to identify obesity genes, and the discovery of loci for polygenic forms of obesity in the mouse is an important next step. To pursue this goal, the inbred mouse strains 129P3/J (129) and C57BL/6ByJ (B6), which differ in body weight, body length, and adiposity, were used in an F2 cross to identify loci affecting these phenotypes. Linkages were determined in a two-phase process. In the first phase, 169 randomly selected F2 mice were genotyped for 134 markers that covered all autosomes and the X Chromosome (Chr). Significant linkages were found for body weight and body length on Chr 2. In addition, we detected several suggestive linkages on Chr 2 (adiposity), 9 (body weight, body length, and adiposity), and 16 (adiposity), as well as two suggestive sex-dependent linkages for body length on Chrs 4 and 9. In the second phase, 288 additional F2 mice were genotyped for markers near these regions of linkage. In the combined set of 457 F2 mice, six significant linkages were found: Chr 2 (Bwq5, body weight and Bdln3, body length), Chr 4 (Bdln6, body length, males only), Chr 9 (Bwq6, body weight and Adip5, adiposity), and Chr 16 (Adip9, adiposity), as well as several suggestive linkages (Adip2, adiposity on Chr 2, Bdln4 and Bdln5, body length on Chr 9). In addition, there was a suggestive linkage to body length in males on Chr 9 (Bdln4). For adiposity, there was evidence for epistatic interactions between loci on Chr 9 (Adip5) and 16 (Adip9). These results reinforce the concept that obesity is a complex trait. Genetic loci and their interactions, in conjunction with sex, age, and diet, determine body size and adiposity in mice.
Figures


Similar articles
-
Voluntary ethanol consumption by mice: genome-wide analysis of quantitative trait loci and their interactions in a C57BL/6ByJ x 129P3/J F2 intercross.Genome Res. 2002 Aug;12(8):1257-68. doi: 10.1101/gr.129702. Genome Res. 2002. PMID: 12176933 Free PMC article.
-
Quantitative trait loci for individual adipose depot weights in C57BL/6ByJ x 129P3/J F2 mice.Mamm Genome. 2006 Nov;17(11):1065-77. doi: 10.1007/s00335-006-0054-2. Epub 2006 Nov 10. Mamm Genome. 2006. PMID: 17103053 Free PMC article.
-
Body Composition QTLs Identified in Intercross Populations Are Reproducible in Consomic Mouse Strains.PLoS One. 2015 Nov 9;10(11):e0141494. doi: 10.1371/journal.pone.0141494. eCollection 2015. PLoS One. 2015. PMID: 26551037 Free PMC article.
-
Using mouse models to dissect the genetics of obesity.Trends Genet. 2002 Jul;18(7):367-76. doi: 10.1016/s0168-9525(02)02703-8. Trends Genet. 2002. PMID: 12127777 Review.
-
Genetic, physical, and comparative map of the subtelomeric region of mouse Chromosome 4.Mamm Genome. 2002 Jan;13(1):5-19. doi: 10.1007/s0033501-2109-8. Mamm Genome. 2002. PMID: 11773963 Free PMC article. Review.
Cited by
-
Reduced body weight is a common effect of gene knockout in mice.BMC Genet. 2008 Jan 8;9:4. doi: 10.1186/1471-2156-9-4. BMC Genet. 2008. PMID: 18182103 Free PMC article.
-
QTL for body composition on chromosome 7 detected using a chromosome substitution mouse strain.Obesity (Silver Spring). 2008 Feb;16(2):483-7. doi: 10.1038/oby.2007.26. Obesity (Silver Spring). 2008. PMID: 18239664 Free PMC article.
-
Genetic dissection of intermale aggressive behavior in BALB/cJ and A/J mice.Genes Brain Behav. 2011 Feb;10(1):57-68. doi: 10.1111/j.1601-183X.2010.00640.x. Epub 2010 Oct 5. Genes Brain Behav. 2011. PMID: 20731721 Free PMC article.
-
Systems Genetics of Hepatic Metabolome Reveals Octopamine as a Target for Non-Alcoholic Fatty Liver Disease Treatment.Sci Rep. 2019 Mar 6;9(1):3656. doi: 10.1038/s41598-019-40153-0. Sci Rep. 2019. PMID: 30842494 Free PMC article.
-
Mouse models and type 2 diabetes: translational opportunities.Mamm Genome. 2011 Aug;22(7-8):390-400. doi: 10.1007/s00335-011-9345-3. Epub 2011 Jun 29. Mamm Genome. 2011. PMID: 21713584 Review.
References
-
- Basten C, Weir B, Zeng Z-B (2001) QTL Cartographer (1.15 ed). (North Carolina State University, Raleigh, Department of Statistics)
-
- Brockmann GA, Bevova MR. Using mouse models to dissect the genetics of obesity. Trends Genet. 2002;18:367–376. - PubMed
-
- Brockmann G, Timtchenko D, Das P, Renne U, Freyer G, et al. Detection of QTL for body weight and body fat content in mice using genetic markers. J Anim Breed Genet. 1996;113:373–379.
Publication types
MeSH terms
Substances
Grants and funding
LinkOut - more resources
Full Text Sources
Medical
Molecular Biology Databases
Miscellaneous
