. 2003 Jul;132(3):1249-59.
doi: 10.1104/pp.103.020875.

Localization of nonspecific lipid transfer proteins correlate with programmed cell death responses during endosperm degradation in Euphorbia lagascae seedlings

Affiliations

Localization of nonspecific lipid transfer proteins correlate with programmed cell death responses during endosperm degradation in Euphorbia lagascae seedlings

D Magnus Eklund et al. Plant Physiol. 2003 Jul.

Abstract

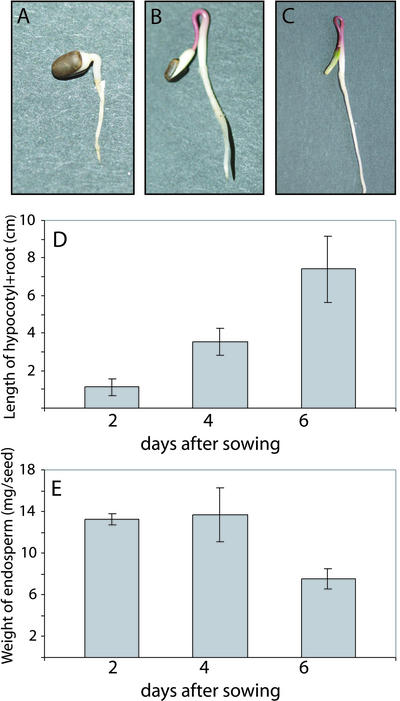
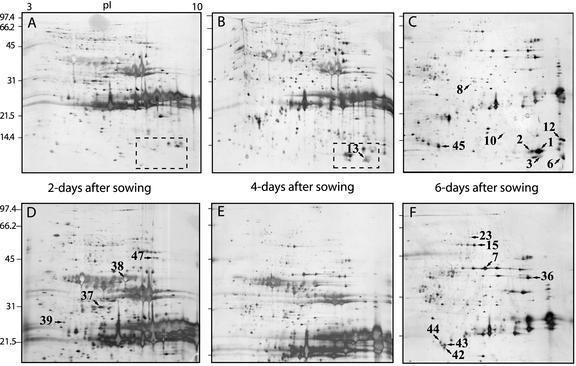
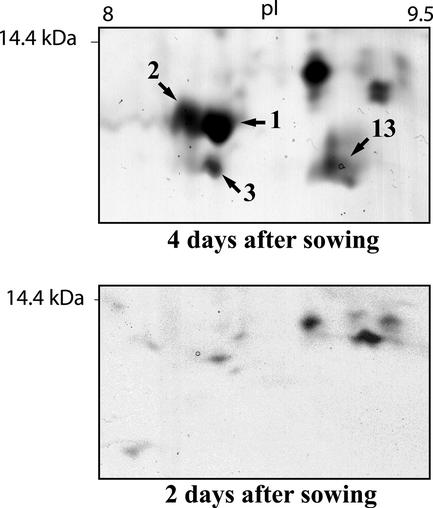
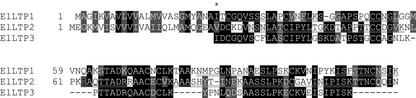
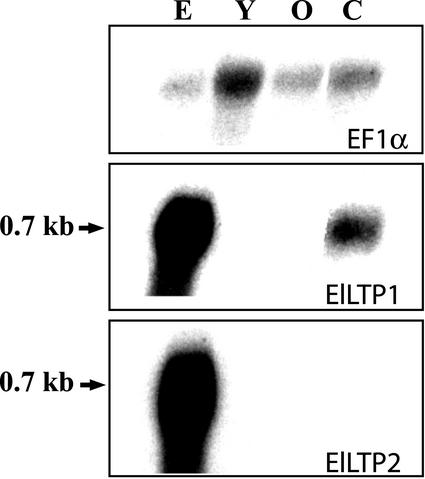
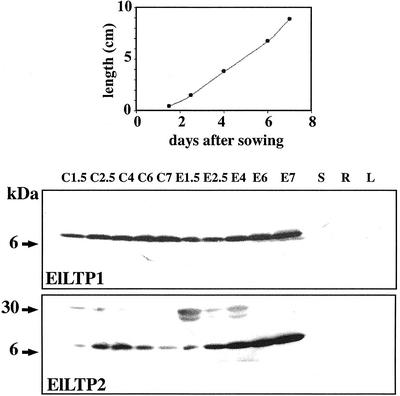
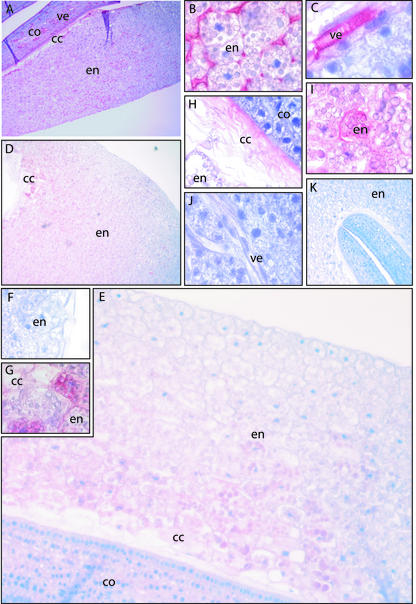
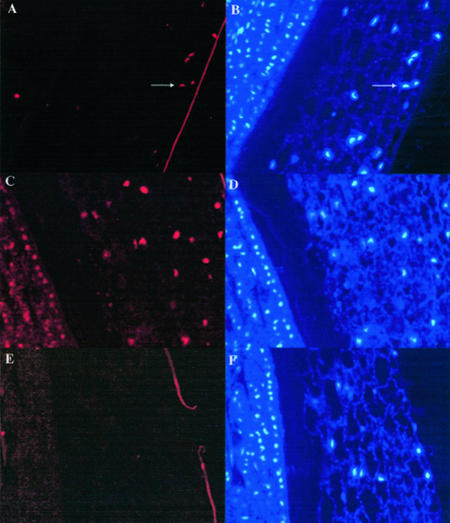
When the storage materials have been depleted, the endosperm cells undergo programmed cell death. Very little is known about how the components of the dying cells are recycled and used by the growing seedling. To learn more about endosperm degradation and nutrient recycling, we isolated soluble proteins from the endosperm of Euphorbia lagascae seedlings collected 2, 4, and 6 d after sowing. The protein extracts were subjected to two-dimensional gel electrophoresis. Proteins that increased in amount in the endosperm with time were selected for further analysis with mass spectrometry. We successfully identified 17 proteins, which became more abundant by time during germination. Among these proteins were three E. lagascae lipid transfer proteins (ElLTPs), ElLTP1, ElLTP2, and ElLTP3. Detailed expressional studies were performed on ElLTP1 and ElLTP2. ElLTP1 transcripts were detected in endosperm and cotyledons, whereas ElLTP2 transcripts were only detected in endosperm. Western blots confirmed that ElLTP1 and ElLTP2 accumulate during germination. Immunolocalization experiments showed that ElLTP1 was present in the vessels of the developing cotyledons, and also in the alloplastic space in the endosperm. ElLTP2 formed a concentration gradient in the endosperm, with higher amounts in the inner regions close to the cotyledons, and lesser amounts in the outer regions of the endosperm. On the basis of these data, we propose that ElLTP1 and ElLTP2 are involved in recycling of endosperm lipids, or that they act as protease inhibitors protecting the growing cotyledons from proteases released during programmed cell death.


Figures

Figure 1.
Figure 1.
Growth of E. lagascae seedlings. A, Seedling 2 d after sowing. B, Seedling 4 d after sowing. C, Seedling 6 d after sowing. D, Graph showing the length (cm) of the hypocotyl + root at 2, 4, and 6 d after sowing. E, The average weight (mg seed1) of the endosperm in each seed. Values are the means of at least 11 independent measurements. Error bars indicate 1 sd.
Figure 2.
Figure 2.
Silver-stained two-dimensional gels that indicate the differences in the endosperm proteome during different stages of seed germination. Proteins were extracted from E. lagascae endosperm 2, 4, and 6 d after sowing. Gels containing 15% or 12.5% (w/v) polyacrylamide were used for second dimension electrophoresis. A, 2 d after sowing, 15% (w/v) polyacrylamide. B, 4 d after sowing, 15% (w/v) acrylamide. C, 6 d after sowing, 15% (w/v) polyacrylamide. D, 2 d after sowing, 12.5% (w/v) polyacrylamide. E, 4 d after sowing, 12.5% (w/v) polyacrylamide. F, 6 d after sowing, 12.5% (w/v) polyacrylamide. All six gels were made with the same low molecular mass protein standard having a range from approximately 97 to 14 kD. pI values indicated in gel A, ranging from 3 to 10, apply to all gels. The numbers refer to the protein spot numbers in Table I. Dashed squares in A and B indicate part of gels enhanced in Figure 3.
Figure 3.
Figure 3.
Close-up of the lower right part (indicated in Fig. 2, A and B, by a dashed square) of the 2- and 4-d gels, showing the identified LTP spots in greater detail. The numbers refer to the spot numbers in Table I. The position of the 14.4-kD molecular mass marker as well as approximate pI values of 8 to 9.5 are displayed.
Figure 4.
Figure 4.
Multiple sequence alignment of ElLTP1 and ElLTP2 with MS/MS acquired peptides of the putative ElLTP3. Black boxes indicate that identical amino acids are present in at least two-thirds of the sequences compared, whereas gray boxes indicate that amino acids with similar physiochemical properties are present in two-thirds of the compared sequences. Peptides sequenced obtained in MS/MS analysis of ElLTP1 and ElLTP2 are underlined. The presumptive N terminus of the mature ElLTP1 is indicated by an asterisk. It should be noted that when sequencing with MS/MS, it is not possible to tell the difference between residues of equal molecular mass, like Leu (L) and Ile (I) or Phe (F) and oxidated Met (M). ElLTP1 and ElLTP2 have the accession numbers AAM00272 and AAM00273 in the National Center for Biotechnology Information database.
Figure 5.
Figure 5.
Northern-blot analysis of RNA isolated from E. lagascae. RNA was isolated from endosperm (E) and cotyledons (C) of germinating seeds 4 d after sowing and from the flowers (stamens and carpels) of adult plants. Old (O) and young (Y) indicates stages in flower development were Y is a bud and O an immature seed pod. The top panel shows hybridization to a probe specific for E. lagascae elongation factor 1-α (EF1α), to verify that roughly the same amounts of RNA had been loaded in each well. The middle panel displays hybridization to the ElLTP1 probe, and the bottom panel displays hybridization to the ElLTP2 probe. The numbers to the left indicates approximate transcript sizes.
Figure 6.
Figure 6.
Western-blot analysis of ElLTP1 and ElLTP2. The diagram (top panel) shows average hypocotyl lengths of the seedlings used in the western-blot experiment. Total proteins were extracted from cotyledons (C) and endosperm (E) collected from seedlings at 1.5, 2.5, 4, 6, and 7 d after sowing. Stems (S), roots (R), and leaves (L) were from adult plants. Protein detection was performed using affinity-purified anti-ElLTP1 (middle panel) or anti-ElLTP2 (bottom panel) antisera. Approximate protein sizes according to the protein standard are indicated to the left.
Figure 7.
Figure 7.
Immunohistochemistry using antibodies against ElLTP1 and ElLTP2 on sectioned seedlings collected 4 d after sowing. Red color indicates detection of antigen, and blue color is counter staining of nuclei with Mayers hematoxylin. A through C, Result after staining with the anti-ElLTP1 antibody. D through J, Result with the anti-ElLTP2 antibody. K, Negative control, which is stained without primary antibody. A, Overview of anti-ElLTP1 staining in the endosperm (en), collapsed cell region (cc), and cotyledons (co). B, Detection of the ElLTP1 in apoplastic space in the middle part of the endosperm. C, Detection of ElLTP1 in the vessel elements (ve) of the cotyledons. D, Overview of anti-ElLTP2 staining in the endosperm and collapsed cell region. E, A closer view of the detection of ElLTP2 in endosperm, cc region and the cotyledons. F, The weak anti-ElLTP2 staining in the outmost part of the endosperm. G, A strong anti-ElLTP2 signal was obtained from the inner part of the endosperm. H, Detection of ElLTP2 in the cc region. I, In the endosperm, ElLTP2 was detected between and also inside cells. J, ElLTP2 was not detected in vessel elements or other cells of the cotyledons.
Figure 8.
Figure 8.
nDNA fragmentation in germinating E. lagascae seedlings. The progress of PCD was analyzed using the TUNEL-assay that detects DNA-fragmentation. Sections were prepared from endosperm and cotyledons from seedling collected 4 d after sowing. A, DNA-fragmentation was detected in the outermost layers of the endosperm. The arrows point toward TUNEL-positive nuclei. B, The section from A was counter stained with DAPI to visualize the nuclei. The arrows in A and B point toward the same nucleus after detection of the red fluorochrome from the TUNEL assay (A) or after detection of the DAPI staining (B). C, The positive control slides were treated with DNase I. D, DAPI staining of the positive control slide. E, In the negative control of the TUNEL assay, terminal deoxynucleotidyltransferase was omitted from the experiment. F, Results from counter staining of the negative control slide with DAPI.

Similar articles

Cited by

References

    1. Altschul SF, Madden TL, Schäffer AA, Zhang J, Zhang Z, Miller W, Lipman DJ (1997) Gapped BLAST and PSI-BLAST: a new generation of protein database search programs. Nucleic Acids Res 25: 3389–3402 - PMC - PubMed
    1. Aubert S, Gout E, Bligny R, Marty-Mazars D, Barrieu F, Alabouvette J, Marty F, Douce R (1996) Ultrastructural and biochemical characterization of autophagy in higher plant cells subjected to carbon deprivation: control by the supply of mitochondria with respiratory substrates. J Cell Biol 133: 1251–1263 - PMC - PubMed
    1. Beers EP, Freeman TB (1997) Proteinase activity during tracheary element differentiation in zinnia mesophyll cultures. Plant Physiol 113: 873–880 - PMC - PubMed
    1. Beevers H (1980) The role of the glyoxylate cycle, In PK Stumpf, ed, The Biochemistry of Plants, Vol 4. Academic Press, New York, pp 117–130
    1. Bergman P, Edqvist J, Farbos I, Glimelius K (2000) Male-sterile tobacco displays abnormal mitochondrial atp1 transcript accumulation and reduced floral ATP/ADP ratio. Plant Mol Biol 42: 531–544 - PubMed

Publication types

MeSH terms

LinkOut - more resources