. 2003 Jul;14(7):2946-58.
doi: 10.1091/mbc.e02-11-0722. Epub 2003 Apr 4.

Syntaxin 6 regulates Glut4 trafficking in 3T3-L1 adipocytes

Affiliations

Syntaxin 6 regulates Glut4 trafficking in 3T3-L1 adipocytes

H Kumudu I Perera et al. Mol Biol Cell. 2003 Jul.

Abstract

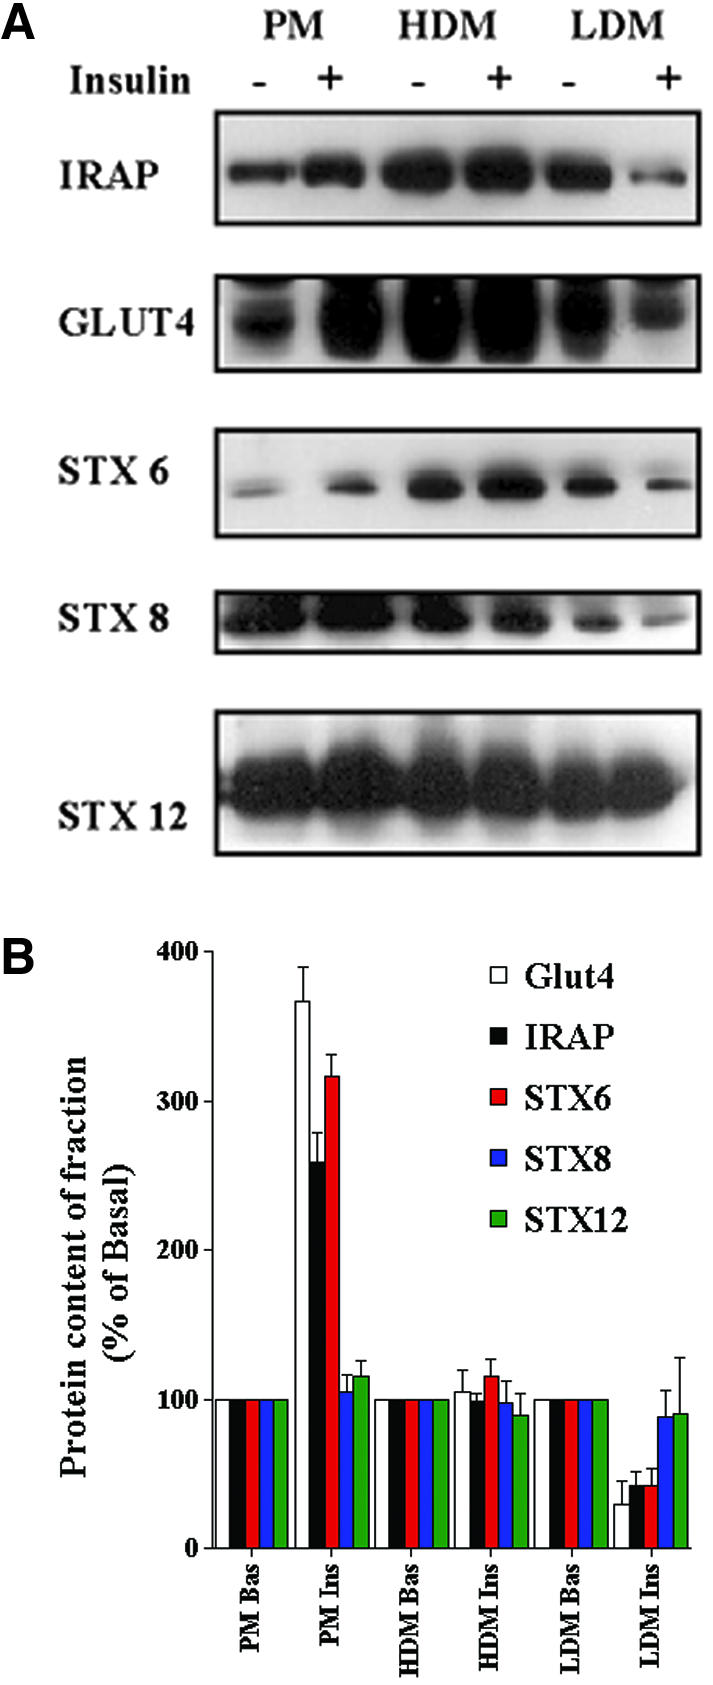
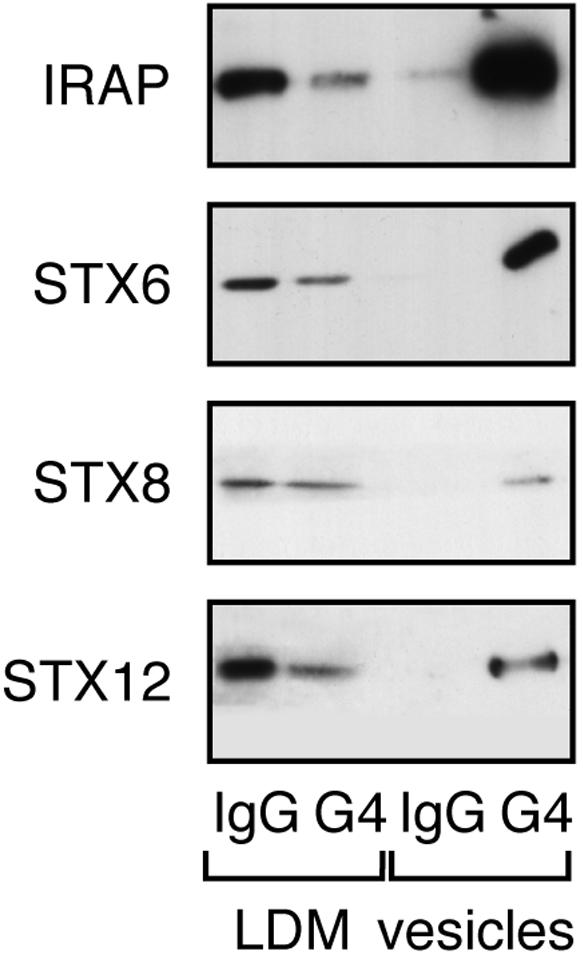
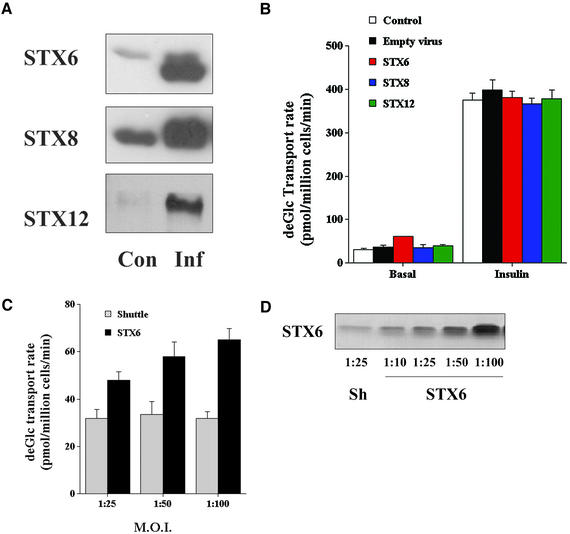
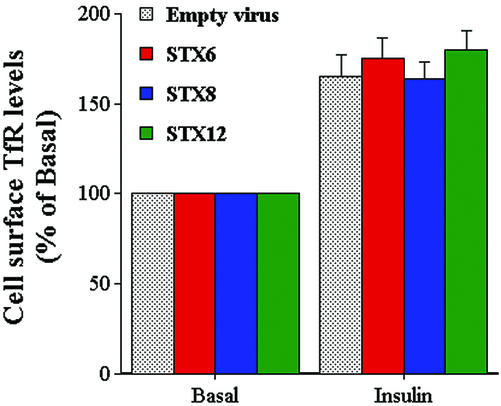
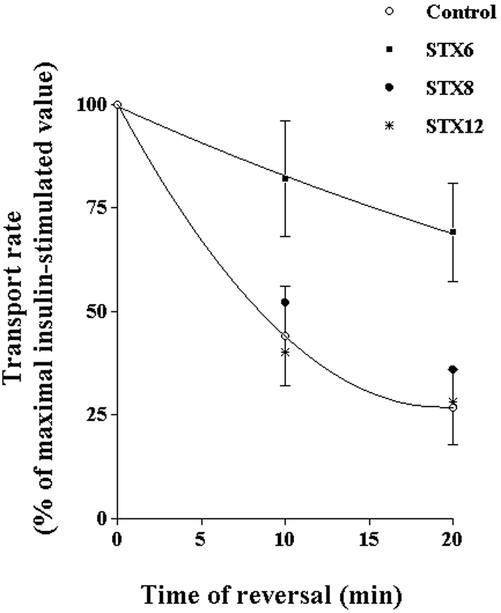
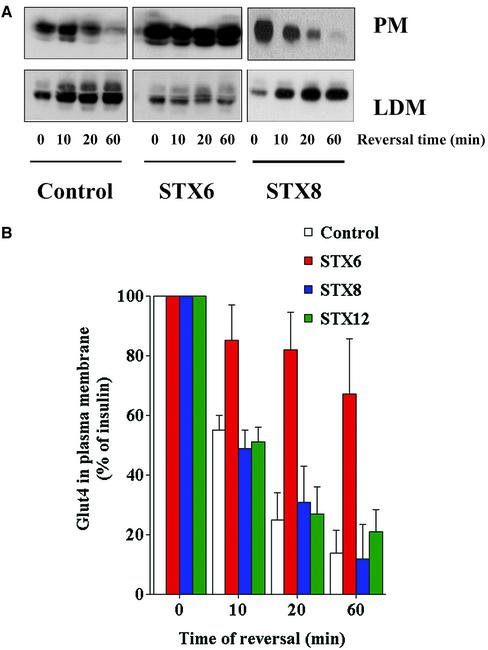
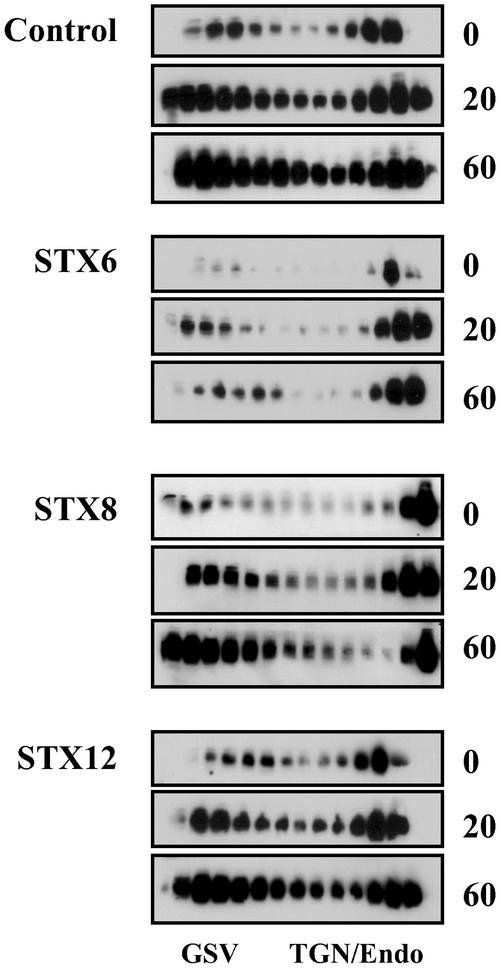
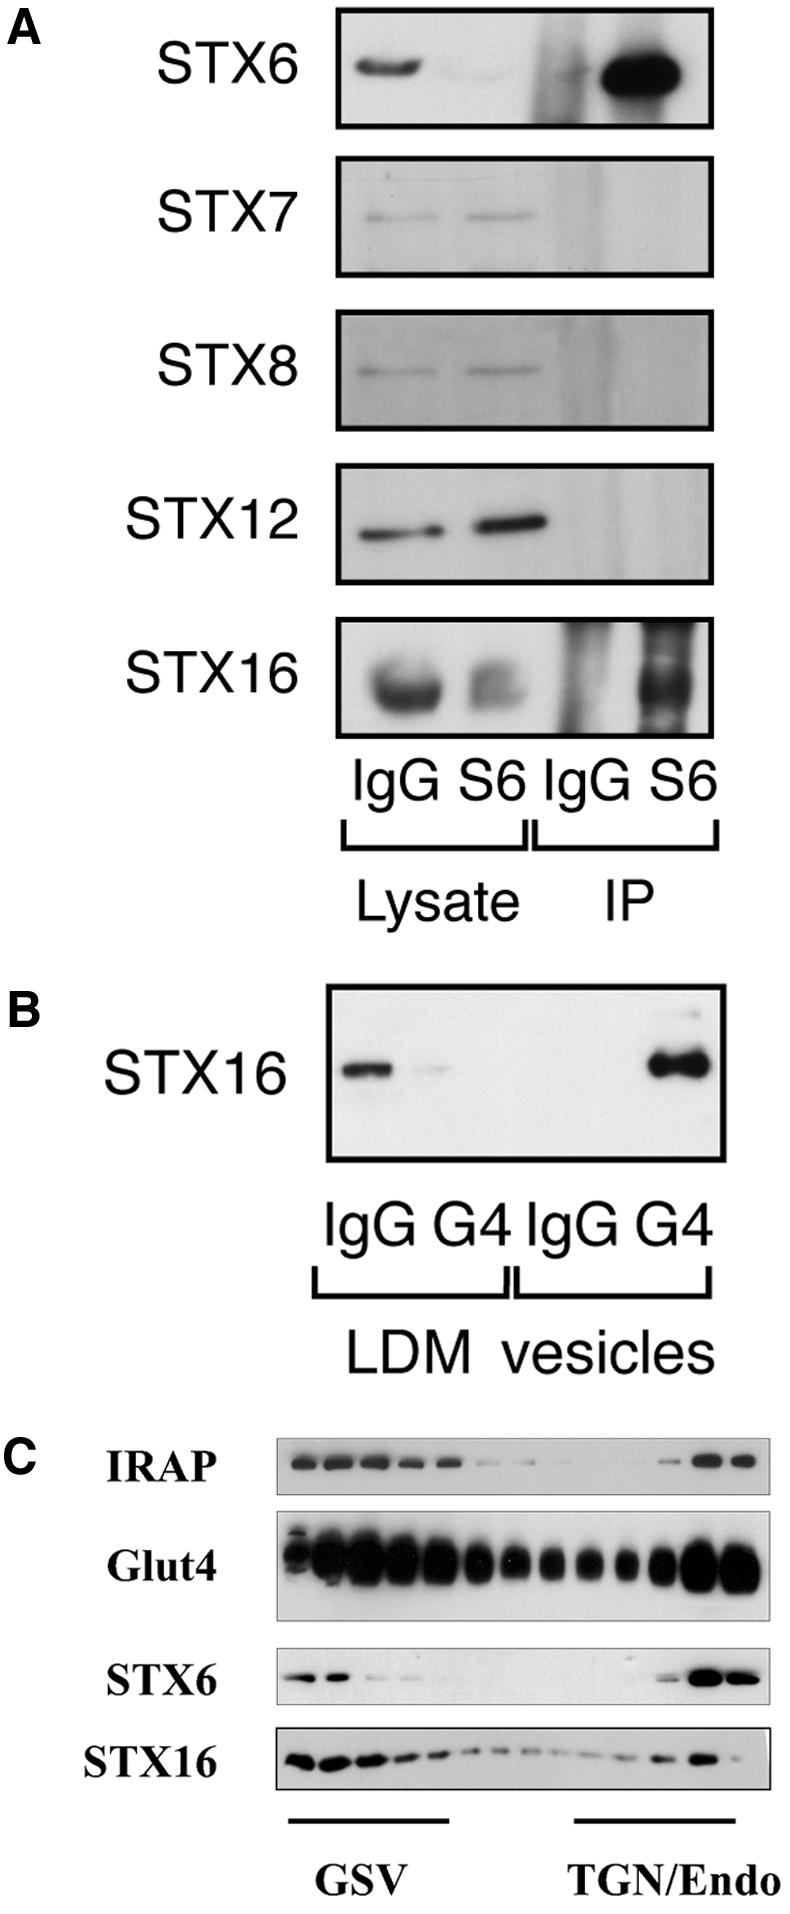
Insulin stimulates the movement of glucose transporter-4 (Glut4)-containing vesicles to the plasma membrane of adipose cells. We investigated the role of post-Golgi t-soluble N-ethylmaleimide-sensitive factor attachment protein receptors (SNAREs) in the trafficking of Glut4 in 3T3-L1 adipocytes. Greater than 85% of syntaxin 6 was found in Glut4-containing vesicles, and this t-SNARE exhibited insulin-stimulated movement to the plasma membrane. In contrast, the colocalization of Glut4 with syntaxin 7, 8, or 12/13 was limited and these molecules did not translocate to the plasma membrane. We used adenovirus to overexpress the cytosolic domain of these syntaxin's and studied their effects on Glut4 traffic. Overexpression of the cytosolic domain of syntaxin 6 did not affect insulin-stimulated glucose transport, but increased basal deGlc transport and cell surface Glut4 levels. Moreover, the syntaxin 6 cytosolic domain significantly reduced the rate of Glut4 reinternalization after insulin withdrawal and perturbed subendosomal Glut4 sorting; the corresponding domains of syntaxins 8 and 12 were without effect. Our data suggest that syntaxin 6 is involved in a membrane-trafficking step that sequesters Glut4 away from traffic destined for the plasma membrane. We speculate that this is at the level of traffic of Glut4 into its unique storage compartment and that syntaxin 16 may be involved.


Figures

Figure 1.
Figure 1.
Subcellular distribution of t-SNAREs in adipocytes and the effect of insulin. 3T3-L1 adipocytes were treated with or without 100 nM insulin for 30 min. Cells were homogenized and plasma membrane (PM), HDM and LDM fractions were separated as described in text. SDS-PAGE was performed using equal quantities of protein (15 μg) from each fraction. The distribution of the indicated proteins was then studied by immunoblotting. (A) Data from a single representative experiment. (B) Quantification of data from four independent fractionation experiments of this type (presented relative to basal cells for each fraction, mean + SD). The insulinstimulated increases in plasma membrane levels of Glut4, IRAP, and STX6 are all significant (p <0.05 compared with control cells), as are the corresponding decreases in the LDM fraction (p <0.05).
Figure 2.
Figure 2.
Colocalization of t-SNAREs in Glut4 vesicles. GLUT4 vesicles were isolated from 3T3-L1 adipocyte postnuclear supernatants as described in text. anti GLUT4 (7.5 μg) or anti-rabbit Ig/10-cm plate cell homogenate was used. LDM (1.9%) and 5% of vesicles were used for SDS-PAGE and subsequent immunoblotting with the antibodies shown. The four lanes of each immunoblot are (from left to right): LDM IgG, LDM recovered after immunoadsorption by using rabbit IgG; LDM G4, LDM recovered after immunoadsorption by using anti GLUT4; Ves IgG, vesicle fraction recovered after immunoadsorption by using rabbit IgG; and Ves G4, vesicle fraction recovered after immunoadsorption by using anti GLUT4. The data shown are from a representative experiment, repeated three further times with similar results. For quantification, see text. Note that Glut4 is not observed in the Ves G4 lane, as in agreement with other studies (Cain et al., 1992; Mastik et al., 1994; Ross et al., 1998), in our hands most of Glut4 remains associated with the antibody under the conditions used to solubilize the vesicles.
Figure 3.
Figure 3.
Adenoviral delivery of cytosolic t-SNARE domains. (A) 3T3-L1 adipocytes were infected with adenovirus designed to overexpress the cytosolic domains of STX6, 8, or 12, or empty virus at an m.o.i. of 50:1 on day 6 postdifferentiation. Forty-eight hours later, cell lysates were prepared and immunoblotted with antibodies to the indicated STX. As shown, the virus drives high-level overexpression of each of the cognate STX cytosolic domains. These data were derived from the same cells used in the experiment shown in B. (B) Cells infected as described above were incubated in serum-free media for 2 h and deGlc uptake assayed in cells incubated with or without 1 μM insulin for 30 min. The data shown (from an experiment repeated four times) are the mean and SD of triplicate determinations at each point. There are no significant effects on insulin-stimulated transport rates. Basal transport in cells expressing STX6 was significantly elevated compared with control cells (p <0.03). (C) Illustration of elevated basal rates of transport observed upon overexpression of the STX6 cytosolic domain vary with m.o.i. The increased value of basal transport compared with empty vector-infected cells was significant at each m.o.i. (p < 0.03). (D) Representative immunoblots of whole cell lysates from 3T3-L1 adipocytes infected with either empty vector (Sh) or STX6 at the indicated m.o.i.
Figure 4.
Figure 4.
Effect of STX cytosolic domain overexpression on transferrin receptor levels at the surface of 3T3-L1 adipocytes. 3T3-L1 adipocytes were infected with either empty virus or virus expressing the cytosolic domains of STX6, 8, and 12 on day 6 and assayed 48 later. Before assay, cells were incubated in serum-free media for 2 h and cell surface transferrin receptor levels assayed in cells incubated with or without insulin for 1 h. Note that both basal and insulin-stimulated levels of transferring-receptor (TfR) were similar among all groups, i.e., viral infection per se had no effect on TfR levels. Moreover, expression of STX cytosolic domains was without effect on basal or insulin-stimulated cell surface TfR levels. The experiment was repeated three times with similar results.
Figure 5.
Figure 5.
STX6 cytosolic domain slows the reversal of insulinstimulated deGlc transport. 3T3-L1 adipocytes were infected with either empty virus or virus expressing the cytosolic domains of STX6, 8, and 12 on day 6 and assayed 48 later. Before assay, cells were incubated in serum-free media for 2 h. After transfer to a heated-plate incubator, cells were stimulated with 100 nM insulin for 20 min, and then either assayed immediately or washed in KRM to induce reversal of insulin-stimulated deGlc transport for the times shown. DeGlc was assayed as described in text, and the data shown are mean values of triplicate determinations (+ SD, for clarity only the curves and errors for STX6 and control cells are shown). The data shown are the average values from six independent experiments (mean + S.D.). Analysis of the data showed that the rate of reversal of insulin-stimulated deGlc transport was significantly slower in cells overexpressing STX6 cytosolic domains compared with empty virus-infected cells, or cells expressing either STX8 or STX12 (*p <0.02 at all time points for each data set).
Figure 6.
Figure 6.
STX6 cytosolic domain perturbs Glut4 reinternalization. (A) Pairs of 10-cm plates of 3T3-L1 adipocytes, treated as outlined in the legend to Figure 5, were homogenized and PM and LDM fractions were separated as described in text. SDS-PAGE was performed using 10% from each fraction. The distribution of the indicated proteins was then studied by immunoblotting. Shown are fractions obtained after insulin-stimulation and reversal for 0, 10, 20, and 60 min. The quantification of this data is presented in B as mean + SD from the three experiments. The rate of Glut4 removal from the plasma membrane is impaired in cells overexpressing STX6 (p < 0.05 at all time points).
Figure 7.
Figure 7.
STX6 cytosolic domain perturbs Glut4 endosomal sorting. The LDM fractions from cells treated as described in the legend to Figure 6 were subjected to iodixanol gradient analysis. Fractions were collected from the bottom of the gradient (left of figure), and SDS-PAGE was performed using 10% of each fraction. The distribution of Glut4 was then determined by immunoblotting, and the position of the GSV and TGN/endosomal Glut4 peaks are indicated. The representative experiment shown was repeated twice with qualitatively similar data.
Figure 8.
Figure 8.
STX6 binds STX16. (A) Syn 6 was immunoprecipitated from lysates of 3T3-L1 adipocytes, as described in text. Anti-syntaxin 6 (mouse monoclonal) and anti-mouse Ig were used at 7.5 μg for cell lysates of a 10-cm dish. The representative immunoblot shown compares the lysate after IP with STX6 or IgG, and the corresponding immunoprecipitated material. In this figure, the lysate corresponds to 2.5% of a 10-cm plate of cells, and the IP corresponds to 15% of the total immunoprecipitate (i.e., 15% of the IP from a single 10-cm plate). (B) Presence within Glut4 vesicles of STX16 (see legend to Figure 2). (C) Iodixanol gradient profile of LDM fractions from basal (nonstimulated) adipocytes immunoblotted for Glut4, STX6, and STX16. The position of the GSV and TGN/endosomal peaks is shown. The representative experiment shown was repeated twice with qualitatively similar data.
Figure 9.
Figure 9.
STX16 is a phosphoprotein. The figure shows the autoradiograph of STX16 immunoprecipitated from 3T3-L1 adipocytes labeled with 32Pi and treated acutely with or without 1 μM insulin for 30 min. Also shown are corresponding immunoprecipitates with random IgG. The experiment was repeated with similar results.

References

    1. Austin, C., Hinners, I., and Tooze, S.A. (2000). Direct and GTP-dependent interaction of ADP-ribosylation factor 1 with clathrin adaptor protein AP-1 on immature secretory granules. J. Biol. Chem. 275, 21862-21869. - PubMed
    1. Brant, A.M., Jess, T.J., Milligan, G., Brown, C.M., and Gould, G.W. 1993. Immunological analysis of glucose transporters expressed in different regions of the rat brain and central nervous system. Biochem. Biophys. Res. Commun. 192, 1297-1302. - PubMed
    1. Bryant, N.J., Govers, R., and James, D.E. (2002). Regulated trafficking of the glucose transporter, Glut4. Nat. Rev. Mol. Cell. Biol. 3, 267-277. - PubMed
    1. Byrant, N.J., Govers, R., and James, D.E. (2002). Regulated transport of the glucose transporter GLUT4. Mol. Cell. Biol. 3, 267-277. - PubMed
    1. Cain, C.C., Trimble, W.S., and Lienhard, G.E. (1992). Members of the VAMP family of synaptic vesicle proteins are components of glucose transporter-containing vesicles from rat adipocytes. J. Biol. Chem. 267, 11681-11684. - PubMed

Publication types

MeSH terms

LinkOut - more resources