. 2003 Aug;77(15):8310-21.
doi: 10.1128/jvi.77.15.8310-8321.2003.

Long-term latent murine Gammaherpesvirus 68 infection is preferentially found within the surface immunoglobulin D-negative subset of splenic B cells in vivo

Affiliations

Long-term latent murine Gammaherpesvirus 68 infection is preferentially found within the surface immunoglobulin D-negative subset of splenic B cells in vivo

David O Willer et al. J Virol. 2003 Aug.

Abstract

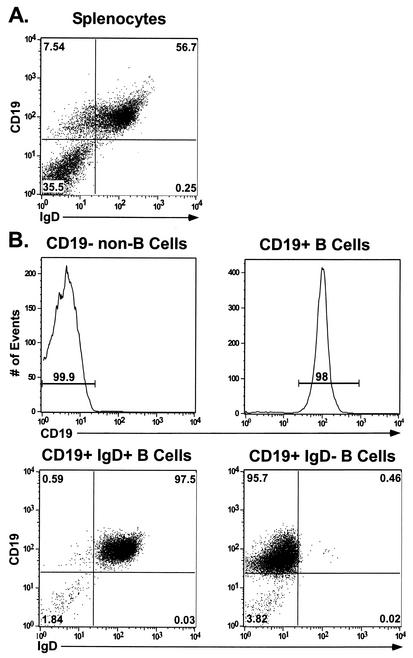
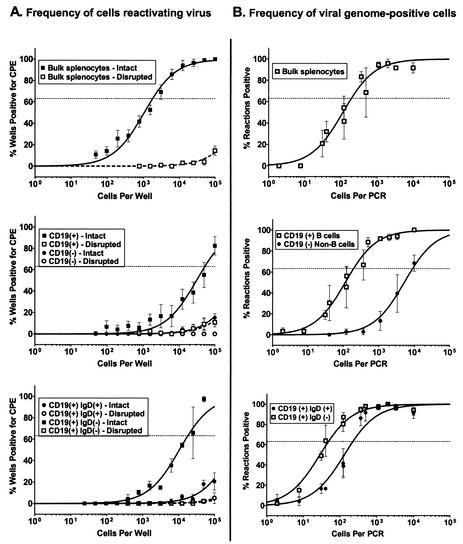
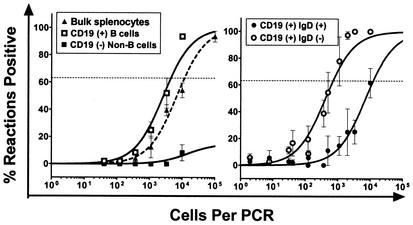
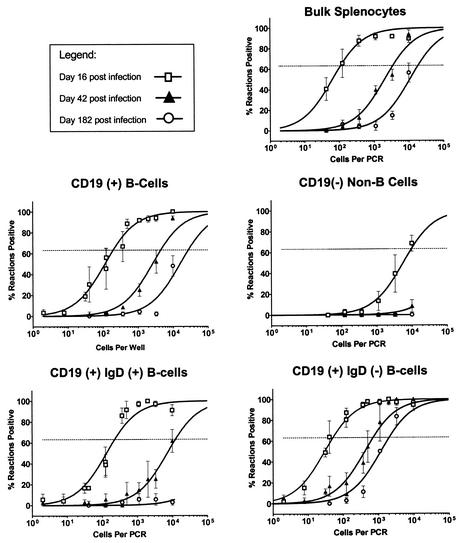
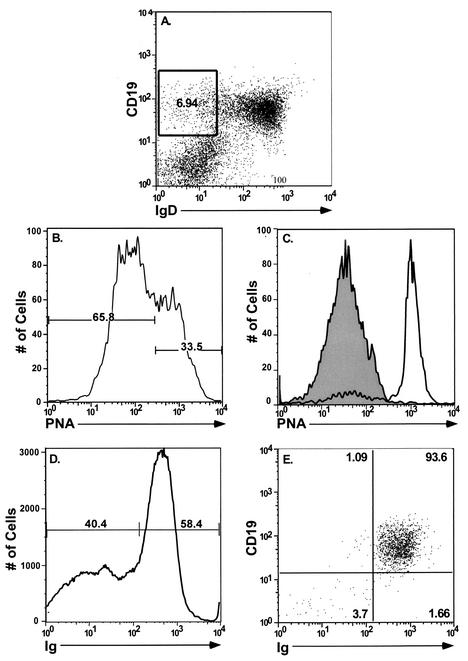
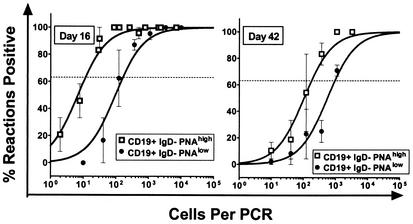
Murine gammaherpesvirus 68 (gammaHV68; also known as MHV-68) can establish a latent infection in both inbred and outbred strains of mice and, as such, provides a tractable small-animal model to address mechanisms and cell types involved in the establishment and maintenance of chronic gammaherpesvirus infection. Latency can be established at multiple anatomic sites, including the spleen and peritoneum; however, the contribution of distinct cell types to the maintenance of latency within these reservoirs remains poorly characterized. B cells are the major hematopoietic cell type harboring latent gammaHV68. We have analyzed various splenic B-cell subsets at early, intermediate, and late times postinfection and determined the frequency of cells either (i) capable of spontaneously reactivating latent gammaHV68 or (ii) harboring latent viral genome. These analyses demonstrated that latency is established in a variety of cell populations but that long-term latency (6 months postinfection) in the spleen after intranasal inoculation predominantly occurs in B cells. Furthermore, at late times postinfection latent gammaHV68 is largely confined to the surface immunoglobulin D-negative subset of B cells.


Figures

FIG. 1.
FIG. 1.
FACS analysis of purified splenic lymphocyte populations. Splenocytes collected from C57BL/6J mice were isolated and prepared as described in Materials and Methods. Cells were fractionated into B-cell and non-B-cell populations by staining with a PE-conjugated antibody to the pan-B-cell marker CD19. CD19+ cells were further fractionated into IgD+ and IgD B-cell subsets by using an FITC-conjugated antibody to IgD. Flow cytometric dot plots from one representative experiment are shown. (A) Unfractionated total splenocytes stained with a pan-B-cell marker (CD19-PE) and FITC-conjugated IgD. (B) Postsort FACS analysis indicating purity of sorted lymphocyte subsets. The mean purities over four replicate experiments were as follows: CD19+ (96.5% ± 2.82%), CD19 (97.6% ± 4.72%), CD19+ IgD+ (95.7% ± 2.4%), and CD19+ IgD (92% ± 3.7%). The extent of contamination of sorted populations was limited to 2.72% ± 0.6 and 0.93% ± 0.46 for the CD19+ and CD19 fractions, respectively. Purified IgD+ and IgD B-cell subsets demonstrated only minimal contamination of 0.63% ± 0.08% and 0.75% ± 0.18%, respectively, with the unwanted cell type.
FIG. 2.
FIG. 2.
Survey of splenic latency 16 days after intranasal infection. Bulk splenocytes or FACS-sorted splenic cell populations were obtained from γHV68-infected C57BL/6J mice at 16 dpi and analyzed by limiting-dilution ex vivo reactivation and limiting-dilution viral-genome PCR assays. (A) Frequency of cells reactivating virus. For the ex vivo reactivation assay, serial dilutions of live, intact cells (solid symbols and lines) were plated on MEF indicator monolayers in parallel with samples that had been mechanically disrupted in order to distinguish between virus reactivation from latency and virus replication resulting from preformed infectious virus (open symbols and dashed lines) (see Materials and Methods). (B) Frequency of cells harboring viral genome. The frequency of viral-genome-positive cells was determined by using an LD-PCR assay. Serial dilutions of cells were plated into a background of 104 uninfected cells, lysed, and analyzed by a nested PCR to detect viral genome (see Materials and Methods). For both assays, curve fit lines were derived from nonlinear regression analysis, and symbols represent mean percentages of wells positive for virus (viral DNA or CPE) ± the standard error of the mean (SEM). The dashed line represents 63.2%, from which the frequency of viral-genome-positive cells or the frequency of cells reactivating virus was calculated based on a Poisson distribution. The data shown represent at least three independent experiments, with cells pooled from 10 mice per experimental group.
FIG. 3.
FIG. 3.
Analysis of splenic latency 42 dpi after intranasal infection. Bulk splenocytes or specific FACS-sorted splenic cell subsets were obtained at 42 dpi. Cell populations were analyzed for the frequency of viral-genome-positive cells by LD-PCR as described in Materials and Methods. The data shown represent at least three independent experiments, with cells pooled from 10 mice per experimental group. Curve fit lines were derived from nonlinear regression analysis, and symbols represent mean percentages of wells positive for viral genome. The error bars represent the SEM. Frequency analysis was based on the Poisson distribution with the horizontal dashed line at 63.2%. Symbols: ▴, unsorted splenocytes; □, CD19+ (B cells); ▪, CD19 (non-B cells); ○, CD19+ IgD; •, CD19+ IgD+ (naive B cells).
FIG. 4.
FIG. 4.
Long-term splenic latency is maintained within the IgD subset of B cells in vivo. Bulk splenocytes and FACS-sorted splenic subsets were obtained at days 16 (□), 42 (▴), and 182 (○) postinfection after infection of C57BL/6J mice with γHV68. Cells were analyzed for the frequency of genome-positive cells by LD-PCR as described in Materials and Methods. The data demonstrate a decrease in overall frequency of viral-genome-positive cells from all compartments over the time course analyzed. The data shown represent three to four independent experiments, with cells pooled from 10 mice per experiment. Curve fit lines were derived from nonlinear regression analysis, and symbols represent mean percentages of wells positive for viral genome ± the SEM. Frequency analysis was based on the Poisson distribution with the horizontal dashed line at 63.2%. Symbols: □, 16 dpi (early); ▴, 42 dpi (intermediate); ○, 182 dpi (late).
FIG. 5.
FIG. 5.
Analysis of PNA and surface immunoglobulin staining of the sIgD B-cell population. Bulk splenocytes were harvested at 16 and 42 dpi and stained with antibodies directed to CD19, sIgD, and PNA or surface immunoglobulin. (A) Cells phenotypically CD19+ IgD were gated and used for subsequent fractionation with additional cell surface markers. This population represented on average ca. 7.7% of the total splenocyte population. (B) Profile of PNA staining for cells within the gated area at 16 dpi. At this point, 39.3% ± 8.2% of CD19+ IgD cells were PNAhigh, and 59.25% ± 9.3% were PNAlow. At 42 dpi these numbers were 23.3% ± 1.3% and 76.0% ± 2.3%, respectively. (C) Postsort analysis showing an overlay of CD19+ IgD PNAlow (shaded area, 98.9% pure) and CD19+ IgDPNAhigh cells (open area, 82% pure). (D) Staining profile of total splenocytes with a pan-immunoglobulin antibody. (E) Postsort fraction of CD19+ IgD immunoglobulin-positive cells (93.6% pure).
FIG. 6.
FIG. 6.
Latent virus is preferentially found within PNAhigh IgD B cells at 16 and 42 dpi. Splenocytes were harvested at day 16 (left panel) and day 42 (right panel) and FACS sorted into CD19+ IgD PNAhigh and CD19+ IgD PNAlow cell subsets. The purified fractions were analyzed for the frequency of cells harboring viral genome by using the LD-PCR assay as described in Materials and Methods. Viral genome was found preferentially within the PNAhigh subset of CD19+ IgD at both early and intermediate times postinfection. The data shown represent two independent experiments, with cells pooled from 10 mice per experiment. Curve fit lines were derived from nonlinear regression analysis, and symbols represent mean percentages of wells positive for viral DNA ± the SEM. Frequency analysis was based on the Poisson distribution with the horizontal dashed line at 63.2%. Symbols: □, CD19+ IgD PNAhigh; •, CD19+ IgD PNAlow.

References

    1. Adler, B., E. Schaadt, B. Kempkes, U. Zimber-Strobl, B. Baier, and G. W. Bornkamm. 2002. Control of Epstein-Barr virus reactivation by activated CD40 and viral latent membrane protein 1. Proc. Natl. Acad. Sci. USA 99:437-442. - PMC - PubMed
    1. Babcock, G. J., L. L. Decker, M. Volk, and D. A. Thorley-Lawson. 1998. EBV persistence in memory B cells in vivo. Immunity 9:395-404. - PubMed
    1. Babcock, G. J., D. Hochberg, and A. D. Thorley-Lawson. 2000. The expression pattern of Epstein-Barr virus latent genes in vivo is dependent upon the differentiation stage of the infected B cell. Immunity 13:497-506. - PubMed
    1. Babcock, G. J., and D. A. Thorley-Lawson. 2000. Tonsillar memory B cells, latently infected with Epstein-Barr virus, express the restricted pattern of latent genes previously found only in Epstein-Barr virus-associated tumors. Proc. Natl. Acad. Sci. USA 97:12250-12255. - PMC - PubMed
    1. Bachmann, M. F., B. Odermatt, H. Hengartner, and R. M. Zinkernagel. 1996. Induction of long-lived germinal centers associated with persisting antigen after viral infection. J. Exp. Med. 183:2259-2269. - PMC - PubMed

Publication types

Substances

LinkOut - more resources