. 2003 Aug;77(15):8408-17.
doi: 10.1128/jvi.77.15.8408-8417.2003.

Hantavirus-specific CD8(+)-T-cell responses in newborn mice persistently infected with Hantaan virus

Affiliations

Hantavirus-specific CD8(+)-T-cell responses in newborn mice persistently infected with Hantaan virus

Koichi Araki et al. J Virol. 2003 Aug.

Abstract

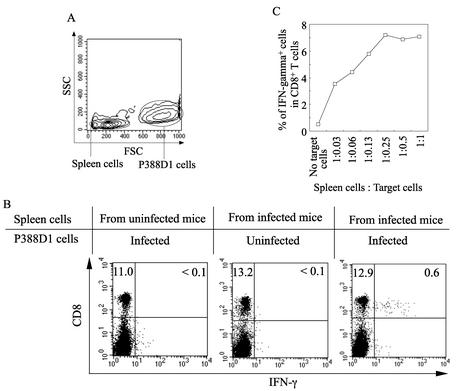
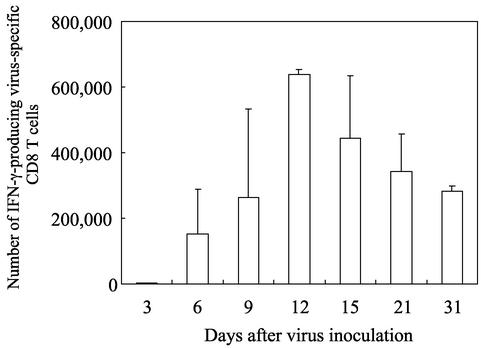
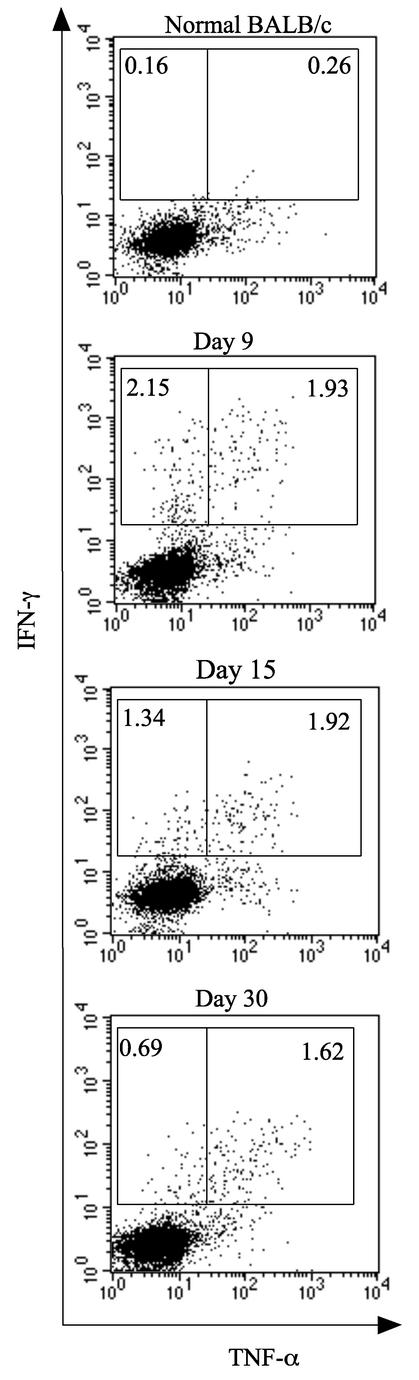
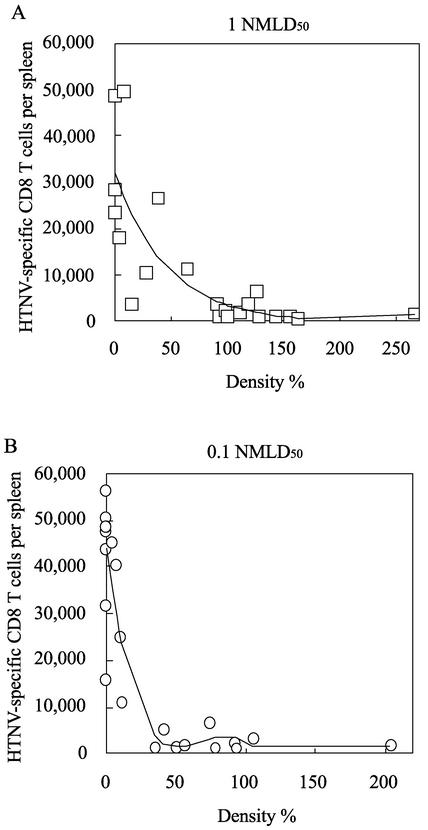
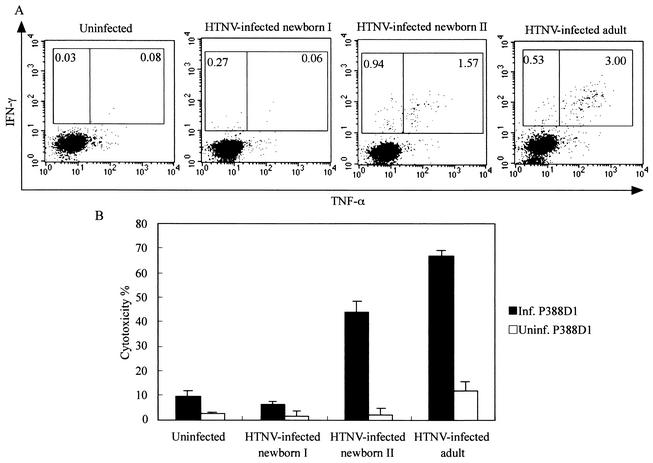
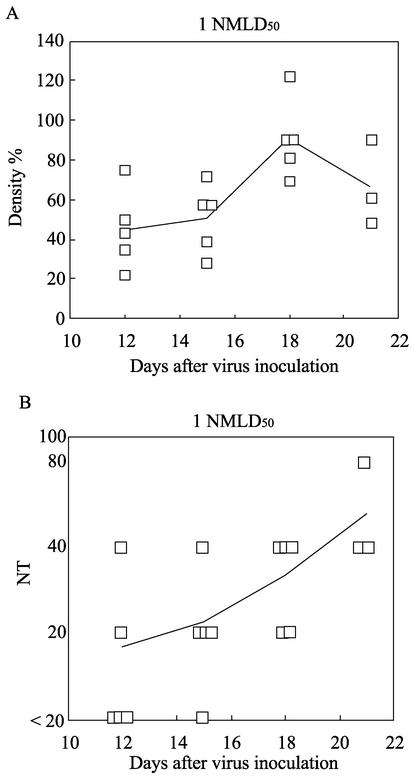
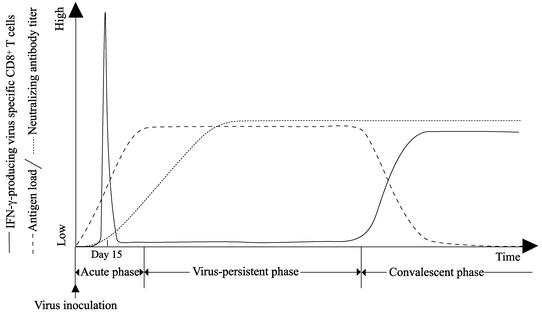
The relationship between virus-specific CD8(+)-T-cell responses and viral persistence was studied in mice by using Hantaan virus (HTNV). We first established a simple method for measuring levels of virus-specific CD8(+) T cells by flow cytometry. Next, to produce a mouse model of persistent HTNV infection, newborn mice were inoculated subcutaneously within 24 h of birth with 1 or 0.1 50% newborn mouse lethal dose of HTNV. All mice that escaped lethal infection were persistently infected with HTNV until at least 30 days after virus inoculation and had no virus-specific CD8(+) T cells producing gamma interferon (IFN-gamma). Subsequently, the virus was eliminated from some of the mice, depending on the appearance of functional virus-specific CD8(+) T cells, which have the ability to produce IFN-gamma and tumor necrosis factor alpha (TNF-alpha) and have cytotoxic activity. Neutralizing antibodies were detected in all mice, regardless of the presence or absence of virus. In the acute phase, which occurs within 30 days of infection, IFN-gamma-producing HTNV-specific CD8(+) T cells were detected on day 15 after virus inoculation. However, TNF-alpha production and the cytotoxic activity of these specific CD8(+) T cells were impaired and HTNV was not removed. Almost all of these specific CD8(+) T cells disappeared by day 18. These results suggest that functional HTNV-specific CD8(+) T cells are important for clearance of HTNV.


Figures

FIG. 1.
FIG. 1.
Establishment of a method for measuring levels of HTNV-specific CD8+ T cells producing IFN-γ. Spleen cells from BALB/c mice with or without HTNV infection were incubated with HTNV-infected or uninfected P388D1 cells for 6 h in the presence of brefeldin A and IL-2. (A) Data from forward scatter (FSC) versus side scatter (SSC) dot plots of cocultured spleen cells and P388D1 cells. (B) Evaluation of CD8+ IFN-γ+ cells was carried out using flow cytometry. The gates were set for spleen cells as in the experiments described for panel A. Spleen cells for experiments whose results are shown in panel B were obtained from HTNV-infected (day 9 after infection) or uninfected adult BALB/c mice and cocultured with P388D1 cells as indicated in panel B. (C) Spleen cells from HTNV-infected adult mice were incubated with P388D1 cells infected by HTNV. Data are presented as frequencies of IFN-γ+ CD8+ cells detected at different ratios of spleen cells to P388D1 cells.
FIG. 2.
FIG. 2.
Immune responses of IFN-γ-producing CD8+ T cells in HTNV-infected adult BALB/c mice. Adult BALB/c mice were inoculated with 2,400 FFU of HTNV. Spleen cells were obtained from three HTNV-infected BALB/c mice on days 3, 6, 9, 12, 15, 21, and 31 after HTNV inoculation. Spleen cells and HTNV-infected P388D1 cells were cocultured at a ratio of 1:0.5 for 6 h in the presence of brefeldin A and IL-2. The number of CD8+ IFN-γ+ cells per spleen was measured using flow cytometry. Data represent the average numbers from three mice. Bars represent the standard deviation at each time point. No CD8+ IFN-γ+ cells were detected from a combination of the spleen cells and uninfected P388D1 cells (data not shown).
FIG. 3.
FIG. 3.
TNF-α production by HTNV-specific CD8+ T cells producing IFN-γ in HTNV-infected adult BALB/c mice. Adult BALB/c mice were inoculated with 2,400 FFU of HTNV. Spleen cells were obtained from HTNV-infected BALB/c mice on days 9, 15, and 30 after HTNV inoculation. Spleen cells and HTNV-infected P388D1 cells were cocultured at a ratio of 1:0.5 for 6 h in the presence of brefeldin A and IL-2. TNF-α production by CD8+ IFN-γ+ cells was detected using flow cytometry. The gates were set for CD8+ T cells, and the numbers are the percentages of TNF-α IFN-γ+ and TNF-α+ IFN-γ+ CD8 T cells. Data from a representative experiment are shown.
FIG. 4.
FIG. 4.
Results of measuring amounts of N protein in the lungs, neutralizing antibody titers (NT) in the sera, and the IFN-γ-producing specific CD8+-T-cell responses in HTNV-infected newborn mice. Within 24 h of birth, newborn mice were inoculated s.c. with 1 NMLD50 (1 LD50) of HTNV or EMEM for mock infection. On days 30 (A), 60 (B), 90 (C), and 120 (D) after virus inoculation, the lungs, sera, and spleens were obtained from surviving mice. White bars represent the amounts of N protein, and black bars represent the numbers of HTNV-specific CD8+ T cells producing IFN-γ. Amounts of N protein in the lungs were measured by Western blotting. Band density was determined by NIH Image 1.6.1 analysis software. To calculate the density of each point, the median density for newborn mice infected with 1 NMLD50 of HTNV on day 30 was set at 100%. Asterisks show that no band was detected. FRNTs were carried out using sera. The neutralizing antibody titer was expressed as the reciprocal of the highest serum dilution resulting in a reduction of greater than 80% in the number of infected cell foci. To detect HTNV-specific CD8+ T cells producing IFN-γ, spleen cells and HTNV-infected P388D1 cells were cocultured at a ratio of 1:0.5 for 6 h in the presence of brefeldin A and IL-2. Data show the number of IFN-γ-producing virus-specific CD8+ T cells per spleen. No CD8+ IFN-γ+ cells were detected from a combination of the spleen cells and uninfected P388D1 cells (data not shown). These results were obtained in two independent experiments. d30-1, sample 1 on day 30.
FIG. 5.
FIG. 5.
Correlation between the amount of N protein and the number of virus-specific CD8+ T cells producing IFN-γ. N protein and IFN-γ-producing virus-specific CD8+-T-cell data were obtained from Fig. 4 (A) and from experiments with newborn mice infected with 0.1 NMLD50 of HTNV (B). Correlation diagrams and regression curves for each virus dose were drawn by EXCEL multivariate analysis version 4.0 add-in software made by ESUMI. The R2 value was calculated for each regression curve (1 NMLD50, R2 = 0.64; 0.1 NMLD50, R2 = 0.83).
FIG. 6.
FIG. 6.
TNF-α production by IFN-γ-producing CD8+ T cells and cytotoxic activity of spleen cells obtained from HTNV-infected newborn mice. Spleen cells isolated from uninfected adult mice, HTNV-infected newborn mice (1 NMLD50) at day 75 after virus inoculation, and HTNV-infected adult mice (2,400 FFU) at day 60 after virus inoculation were tested for TNF-α production (A) and cytotoxic activity (B). Cells classified as “HTNV-infected newborn I” included few IFN-γ-producing CD8+ T cells and those classified as “HTNV-infected newborn II” included many IFN-γ-producing CD8+ T cells. (A) To detect TNF-α+ CD8+ T cells, spleen cells and HTNV-infected P388D1 cells were cocultured at a ratio of 1:0.5 for 6 h in the presence of brefeldin A and IL-2. TNF-α production by CD8+ IFN-γ+ cells was detected using flow cytometry. The gates were set for CD8+ T cells, and the numbers are the percentages of TNF-α IFN-γ+ and TNF-α+ IFN-γ+ CD8 T cells. (B) For the cytotoxic assay, spleen cells were cultured as described in Materials and Methods. The spleen cells were tested using an LDH release cytotoxic assay. HTNV-infected P388D1 cells (Inf. P388D1; positive control) and uninfected P388D1 cells (Uninf. P388D1; negative control) were used as target cells. Bars represent the standard deviations. E/T ratio, 20. Data from a representative experiment are shown.
FIG. 7.
FIG. 7.
N protein content and neutralizing antibody titers (NT) in HTNV-infected newborn mice in the acute phase. Within 24 h of birth, newborn mice were inoculated s.c. with 1 NMLD50 of HTNV. Lungs and sera were obtained from the newborn mice at each time point. (A) The N protein content of the lungs was measured by Western blotting. Band density was determined by NIH Image 1.6.1 analysis software. To calculate the density of each point, the median density for newborn mice infected with 1 NMLD50 of HTNV on day 30 was set at 100% as in Fig. 4. (B) FRNTs were carried out using sera, and the neutralizing antibody titer was expressed as the reciprocal of the highest serum dilution resulting in a reduction of more than 80% of infected cell foci. The average at each time point is represented as a solid line. Results for each viral dose were obtained in two independent experiments.
FIG. 8.
FIG. 8.
TNF-α production by IFN-γ-producing CD8+ T cells and cytotoxic activity of spleen cells obtained from HTNV-infected newborn mice in the acute phase. Spleen cells isolated from HTNV-infected newborn mice (1 NMLD50) at day 15 after virus inoculation were tested for TNF-α production (A) and cytotoxic activity (B). (A) To detect TNF-α+ CD8+ T cells, spleen cells and target cells were cocultured at a ratio of 1:0.5 for 6 h in the presence of brefeldin A and IL-2. IFN-γ+ HTNV-infected P388D1 cells (Inf. P388D1; upper panel) and uninfected P388D1 cells (Uninf. P388D1; lower panel, negative control) were used as target cells. TNF-α production by CD8+ IFN-γ+ cells was detected using flow cytometry. The gates were set for CD8+ T cells, and the numbers are the percentages of TNF-α IFN-γ+ and TNF-α+ IFN-γ+ CD8 T cells. (B) For the cytotoxic assay, spleen cells were cultured as described in Materials and Methods. The spleen cells were tested using an LDH release cytotoxic assay. HTNV-infected P388D1 cells (positive control) and uninfected P388D1 cells (negative control) were used as target cells. The bars represent the standard deviations. E/T ratio, 20. Data from a representative experiment are shown.
FIG. 9.
FIG. 9.
Schema of the fluctuation of the numbers of virus-specific CD8+ T cells, neutralizing antibody titers, and antigen loads (amounts of N protein in lungs) in HTNV-infected newborn mice. In the acute phase, IFN-γ-producing virus-specific CD8+ T cells were induced, but TNF-α production and the cytotoxic activity of these CD8+ T cells were impaired in vitro. In the virus-persistent phase, high neutralizing antibody titers were maintained and there were no functional virus-specific CD8+ T cells. In the convalescent phase, functional virus-specific CD8+ T cells appeared and the amounts of N protein decreased.

Similar articles

Cited by

References

    1. Altman, J. D., P. A. Moss, P. J. Goulder, D. H. Barouch, M. G. McHeyzer-Williams, J. I. Bell, A. J. McMichael, and M. M. Davis. 1996. Phenotypic analysis of antigen-specific T lymphocytes. Science 274:94-96. (Erratum, 280:1821, 1993.) - PubMed
    1. Araki, K., K. Yoshimatsu, M. Ogino, H. Ebihara, A. Lundkvist, H. Kariwa, I. Takashima, and J. Arikawa. 2001. Truncated hantavirus nucleocapsid proteins for serotyping Hantaan, Seoul, and Dobrava hantavirus infections. J. Clin. Microbiol. 39:2397-2404. - PMC - PubMed
    1. Arikawa, J., M. Ito, J. S. Yao, H. Kariwa, I. Takashima, and N. Hashimoto. 1994. Epizootiological studies of hantavirus infection among urban rats in Hokkaido, Japan: evidences for the persistent infection from the sero-epizootiological surveys and antigenic characterizations of hantavirus isolates. J. Vet. Med. Sci. 56:27-32. - PubMed
    1. Borrow, P., and M. B. A. Oldstone. 1997. Lymphocytic choriomeningitis virus, p. 593-627. In N. Nathanson (ed.), Viral pathogenesis. Lippincott-Raven, Philadelphia, Pa.
    1. Borucki, M. K., J. D. Boone, J. E. Rowe, M. C. Bohlman, E. A. Kuhn, R. DeBaca, and S. C. St. Jeor. 2000. Role of maternal antibody in natural infection of Peromyscus maniculatus with Sin Nombre virus. J. Virol. 74:2426-2429. - PMC - PubMed

Publication types

Substances