. 2003 Jul 22;100(15):8817-22.
doi: 10.1073/pnas.1133470100. Epub 2003 Jul 11.

Transforming single DNA molecules into fluorescent magnetic particles for detection and enumeration of genetic variations

Affiliations

Transforming single DNA molecules into fluorescent magnetic particles for detection and enumeration of genetic variations

Devin Dressman et al. Proc Natl Acad Sci U S A. .

Abstract

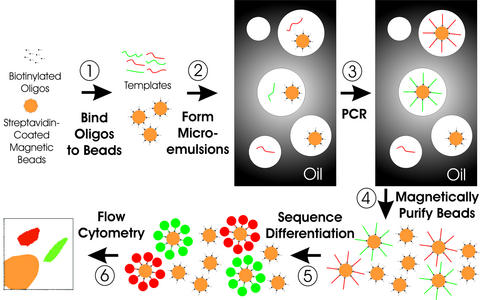
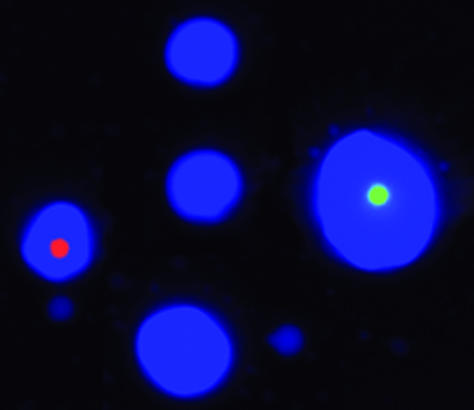
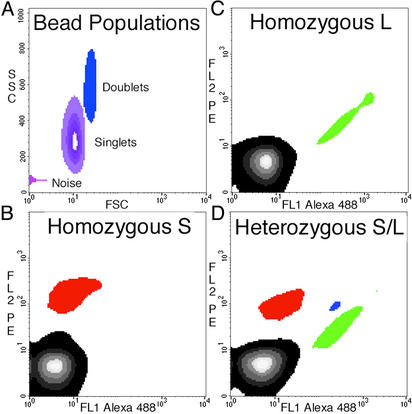
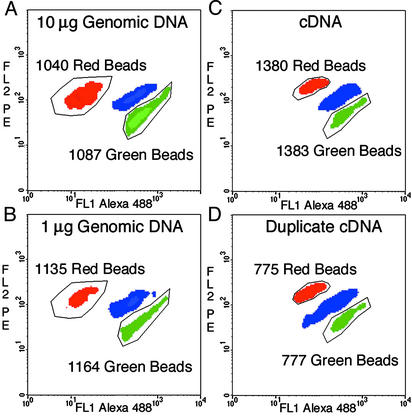
Many areas of biomedical research depend on the analysis of uncommon variations in individual genes or transcripts. Here we describe a method that can quantify such variation at a scale and ease heretofore unattainable. Each DNA molecule in a collection of such molecules is converted into a single magnetic particle to which thousands of copies of DNA identical in sequence to the original are bound. This population of beads then corresponds to a one-to-one representation of the starting DNA molecules. Variation within the original population of DNA molecules can then be simply assessed by counting fluorescently labeled particles via flow cytometry. This approach is called BEAMing on the basis of four of its principal components (beads, emulsion, amplification, and magnetics). Millions of individual DNA molecules can be assessed in this fashion with standard laboratory equipment. Moreover, specific variants can be isolated by flow sorting and used for further experimentation. BEAMing can be used for the identification and quantification of rare mutations as well as to study variations in gene sequences or transcripts in specific populations or tissues.


Figures

Fig. 1.
Fig. 1.
Schematic of BEAMing. Step 1: Magnetic beads covalently coated with streptavidin are bound to biotinylated oligonucleotides (oligos). Step 2: An aqueous mix containing all the necessary components for PCR plus primer-bound beads and template DNA are stirred together with an oil/detergent mix to create microemulsions. The aqueous compartments (white circles in the gray oil layer) contain an average of less than one template molecule and less than one bead. Red and green templates represent two template molecules, the sequences of which differ by one or many nucleotides. Step 3: The microemulsions are temperature-cycled as in a conventional PCR. If a DNA template and a bead are present together in a single aqueous compartment, the bead-bound oligonucleotides act as primers for amplification. The straight red and green lines connected to the beads represent extension products from the two different kinds of templates. Step 4: The emulsions are broken, and the beads are purified with a magnet. Step 5: After denaturation, the beads are incubated with oligonucleotides that can distinguish between the sequences of the different kinds of templates. Fluorescently labeled antibodies then are used to label the bound hybridization probes, which renders the beads containing PCR product as red or green after appropriate laser excitation. Step 6: Flow cytometry is used to count the red and green beads.
Fig. 2.
Fig. 2.
Photograph of a typical microemulsion. Microemulsions were made as described in Materials and Methods with the exception that the aqueous compartments contained cascade blue-labeled dCTP and the beads were prelabeled by binding to oligonucleotides coupled to R-phycoerythrin (red) or Alexa 488 (green). One microliter of microemulsion was deposited in 1 μlofoil on a microscope slide before photography. Of the seven aqueous compartments visible in this picture, two contain beads. Note the heterogeneous size of the aqueous compartments (beads are 1.05 μm in diameter).
Fig. 3.
Fig. 3.
Density plots of flow-cytometric data obtained from BEAMing. The locus queried in this experiment was MID42, and PCR products generated from genomic DNA were used as templates in the microemulsions. (A) Forward scatter (FSC) and side scatter (SSC) of all beads show that ≈80% of the total beads are singlets, with most of the remaining beads aggregated as doublets. The “noise” is instrumental and is observed with blank samples containing no beads. The instrument output was gated such that only singlets were analyzed for fluorescence analysis. The patterns observed from an individual homozygous for the L allele (A), homozygous for the S allele (B), and heterozygous for L and S (D) are shown in BD, respectively. The regions containing beads hybridizing to the L and S allele probes are labeled green and red, respectively. The region containing beads that did not hybridize to any probe is black, and the region containing beads that hybridized to both probes is blue. The blue beads arose from aqueous compartments in which both types of template molecules were present. The proportion of singlet beads that hybridized to at least one of the probes was 2.9%, 4.3%, and 20.3% in BD, respectively. The forward-scatter and side-scatter plots in A represent the same beads analyzed in D. FL1, fluorescent channel 1; FL2, fluorescent channel 2; PE, R-phycoerythrin.
Fig. 4.
Fig. 4.
Density plots of BEAMing with genomic DNA or RT-PCR products as templates. The data in A and B were generated by including 10 and 1 μg of human genomic DNA, respectively, in the microemulsions, querying the MID42 locus. The data in C and D were generated by using emulsions that contained ≈50 pg of PCR products synthesized from cDNA of lymphoblastoid cells, querying the calpain-10 locus. The green and red regions correspond to the L and S alleles for MID42 and to the A and G alleles for calpain-10. The number of beads in the outlined regions containing red or green beads is shown in each case. The proportion of singlet beads that hybridized to at least one of the probes was 1.2%, 0.6%, 6.8%, and 4.2% in AD, respectively. The outlined regions used for counting in A and B were identical, as were those used for C and D. Beads that did not hybridize to any probe were gated out and therefore not evident in the graphs, and the region containing beads that hybridized to both probes is labeled blue. FL1, fluorescent channel 1; FL2, fluorescent channel 2; PE, R-phycoerythrin.
Fig. 5.
Fig. 5.
Detection and validation of variants present in a minor fraction of the DNA population. (A) Mixtures of PCR products containing 0–4% L alleles of MID42 were used for BEAMing. Flow cytometry such as that shown in Fig. 3 was used to determine the fraction of singlet beads that were red (y axis). The proportion of singlet beads that hybridized to at least one of the probes varied from 3.2% to 4.3%. (B and C) Beads were sorted with the FACSVantage SE instrument, and individual red or green beads were used as templates for conventional PCR by using the forward and reverse primers listed in Table 1. Red beads generated only the S allele sequence, whereas green beads generated only the L allele sequence.

References

    1. Collins, F. S., Patrinos, A., Jordan, E., Chakravarti, A., Gesteland, R. & Walters, L. (1998) Science 282, 682–689. - PubMed
    1. Vogelstein, B. & Kinzler, K. W. (2002) The Genetic Basis of Human Cancer (McGraw–Hill, Toronto).
    1. Sidransky, D., Von Eschenbach, A., Tsai, Y. C., Jones, P., Summerhayes, I., Marshall, F., Paul, M., Green, P., Hamilton, S. R., Frost, P., et al. (1991) Science 252, 706–709. - PubMed
    1. Ahlquist, D. A. & Shuber, A. P. (2002) Clin. Chim. Acta 315, 157–168. - PubMed
    1. Sidransky, D. (2002) Nat. Rev. Cancer 2, 210–219. - PubMed

Publication types