. 2003 Sep 1;551(Pt 2):403-17.
doi: 10.1113/jphysiol.2003.041723. Epub 2003 Jul 14.

Ca2+-independent, but voltage- and activity-dependent regulation of the NMDA receptor outward K+ current in mouse cortical neurons

Affiliations

Ca2+-independent, but voltage- and activity-dependent regulation of the NMDA receptor outward K+ current in mouse cortical neurons

Tomomi Ichinose et al. J Physiol. .

Abstract

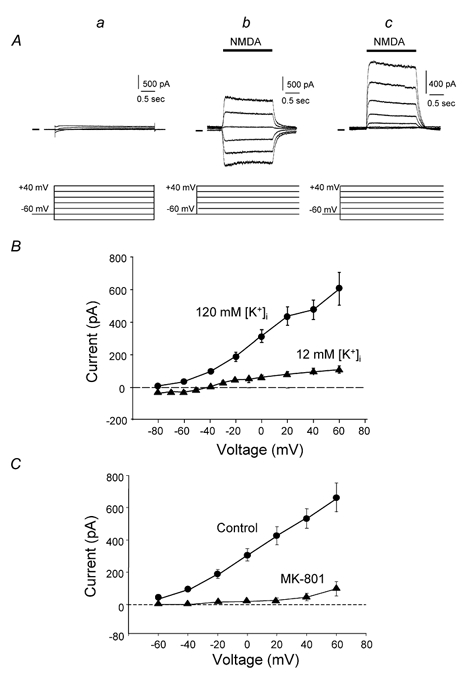
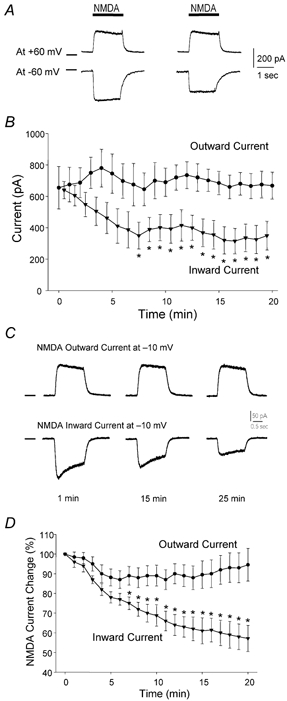
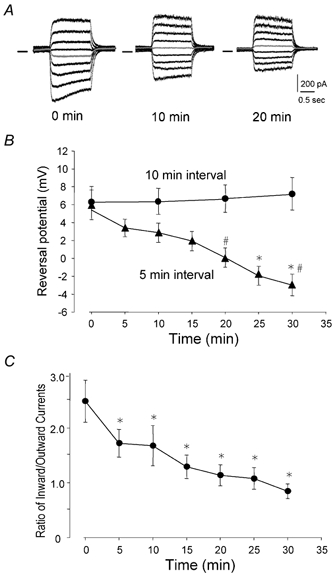
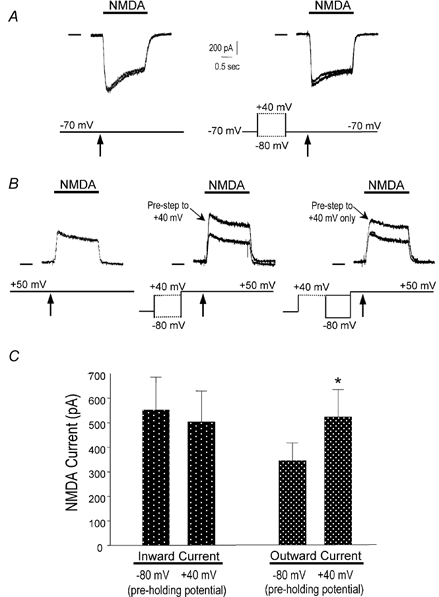
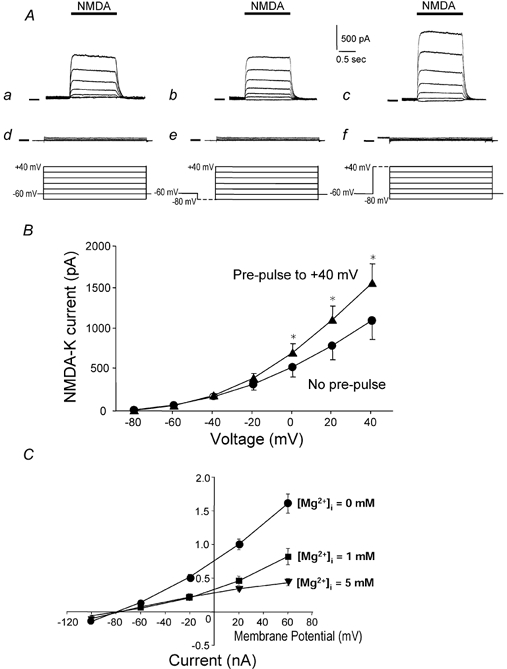
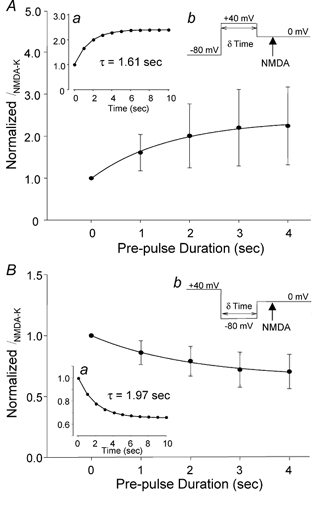
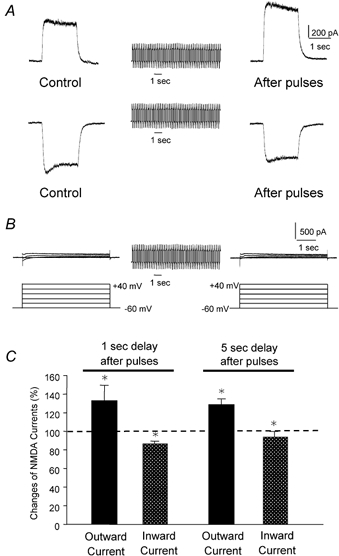
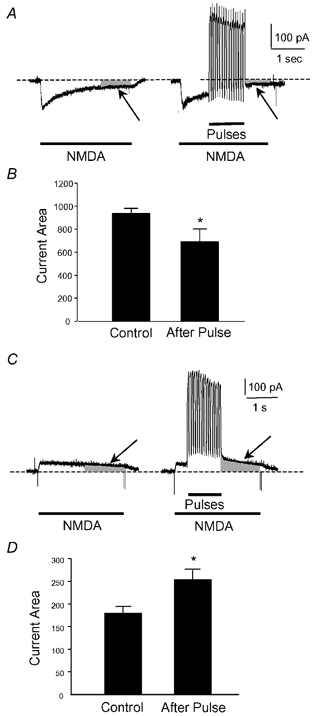
To test the novel hypothesis that the K+ efflux mediated by NMDA receptors might be regulated differently than the influx of Ca2+ and Na+ through the same receptor channels, NMDA receptor whole-cell currents carried concurrently or individually by Ca2+, Na+ and K+ were analysed in cultured mouse cortical neurons. In contrast to the NMDA inward current carried by Ca2+ and Na+, the NMDA receptor outward K+ current or NMDA-K current, recorded either in the presence or absence of extracellular Ca2+ and Na+, and at different or the same membrane potentials, showed much less sensitivity to alterations in intracellular Ca2+ concentration and underwent little rundown. In line with a selective regulation of the NMDA receptor K+ permeability, the ratio of the NMDA inward/outward currents decreased, and the reversal potential of composite NMDA currents recorded in physiological solutions shifted by -8.5 mV after repeated activation of NMDA receptors. Moreover, a depolarizing pre-pulse of a few seconds or a burst of brief depolarizing pulses selectively augmented the subsequent NMDA-K current, but not the NMDA inward current. On the other hand, a hyperpolarizing pre-pulse showed the opposite effect of reducing the NMDA-K current. The voltage- and activity-dependent regulation of the NMDA-K current did not require the existence of extracellular Ca2+ or Ca2+ influx; it was, however, affected by the duration of the pre-pulse and was subject to a time-dependent decay. The burst of excitatory activity revealed a lasting upregulation of the NMDA-K current even 5 s after termination of the pre-pulses. Our data reveal a selective regulation of the NMDA receptor K+ permeability and represent a novel model of voltage- and excitatory activity-dependent plasticity at the receptor level.


Figures

Figure 1
Figure 1. Composite NMDA currents and K+-efflux-carried NMDA outward current
Aa, voltage-activated membrane responses without NMDA application. The line drawing at the bottom illustrates the steps, starting points and ending points of the voltage changes. b, composite NMDA currents, INMDA, evoked by 100 μm NMDA plus 10 μm glycine in an external solution containing 120 mm Na+, 2 mm Ca2+ and 5 mm K+ (120 mm internal K+). The current reversed at ≈ 0 mV. c, NMDA (100 μm) and glycine (10 μm) evoked outward currents carried by K+ efflux, Inmda-k, isolated by recording in a Ca2+-free, Na+-free external solution (substituted by NMDG) and 120 mm internal K+. The currents had a negative reversal potential ≈-80 mV. Current responses were evoked every 20 s and are superimposed. The short horizontal lines that appear before the current traces show the baseline level of the recordings. The voltage diagrams in b and c illustrate a 2 s delay between the voltage starting point and NMDA application; the returning of membrane potentials back to the holding potential is not shown. B, the sensitivity of Inmda-k to intracellular K+. At a low intracellular K+ concentration of 12 mm, the reversal potential shifted to the right and Inmda-k was largely eliminated (n = 5 cells for each point). C, Inmda-k recorded in the Ca2+-free and Na+-free external solution was sensitive to block by MK-801 (10 μm, n = 5 for each group). The glycine antagonist 7-chlorokynurenic acid (10 M) also blocked the current (n = 5; data not shown).
Figure 2
Figure 2. Different Ca2+ sensitivity of inward and outward NMDA currents under physiological conditions
A and B, NMDA outward and inward currents were recorded at +60 and −60 mV alternately in the same cells in the presence of physiological concentrations of extracellular and intracellular Ca2+, Na+ and K+ (see Methods). No Ca2+ chelator was used. A, the NMDA inward current carried by the influx of Ca2+ and Na+ showed time-dependent rundown, meanwhile the outward current generated by K+ efflux remained stable. B, time-dependent rundown of NMDA inward current and lack of rundown of NMDA outward current in the same cells. The time points of the two lines are not matched as a result of alternative recordings in these cells (n = 7). C and D, NMDA receptor inward and outward currents were activated every 5 min at −10 mV with and without extracellular Na+, respectively. Ca2+ (2 mm) was presented in extracellular solutions in both recordings. C, the inward current gradually declined, while the outward current remained stable during 30 min recordings. D, rundown of NMDA inward and outward currents compared at the same membrane potential. In this experiment, both inward and outward currents showed about a 20–30 % reduction between the first and second NMDA stimulations; data shown in the figure were started from the second NMDA responses. Inward and outward currents were recorded in different cells. The short horizontal bars in A and C to the left of the current traces show the baseline level of the recordings (n = 14 and 12 for inward and outward currents, respectively). *P < 0.05 compared with the time-matched outward current.
Figure 3
Figure 3. Time- and activation-dependent reversal potential shifts of composite NMDA currents in physiological solutions
The IV relationship of composite NMDA receptor currents was recorded in regular internal and external solutions. A, the NMDA-stimulated responses at different potentials are superimposed and show a gradually declining inward conductance but stable outward conductance, recorded in the same neuron. NMDA receptor desensitization was seen as an outward rectification of the inward current recorded at 0 min; this desensitization diminished in subsequent responses. Meanwhile, rundown of the steady-state inward current was evident at later time points. Similar changes can be seen with inward currents in other figures. The grey line around the baseline area illustrates the reversal of the current direction, representing the negative shift of the reversal potential. NMDA inward and outward currents were evoked at potentials of −20 to +20 mV, in 5 mV increments. Voltage steps were separated by 9 s intervals; the intra-trial interval between complete IV protocols was 5 min. Similar changes were observed when the IV test was carried out in reverse (i.e. from +20 to −20 mV; data not shown, n = 7), suggesting that both protocols allowed sufficient [Ca2+]i accumulation during the repetitive NMDA receptor activation. B, the line graph illustrates the gradual shift in the reversal potential from 5.4 to −3.2 mV when the IV protocol was applied at 5 min intra-trial intervals. The reversal potential was unaltered when the interval was increased to 10 min. C, the ratio of NMDA inward and outward currents (inward/outward) recorded at −40 and +40 mV, respectively, gradually decreased during the 30 min recordings, consistent with the negative shift of the reversal potential (n = 12–14). * Significantly different from the controls at time 0 (P < 0.05 by ANOVA analysis); # significantly different from time-matched controls (P < 0.05 by t test).
Figure 5
Figure 5. Voltage- and time-dependent selective upregulation of Inmda-k
NMDA inward and outward currents were recorded in a Mg2+-free external solution containing physiological concentrations of Ca2+ and Na+. Nifedipine (2 μm) and TTX (0.5 μm) were added into the external solution to block voltage-gated L-type Ca2+ channels and Na+ channels. To prevent activation of K+ channels, the K+-free internal solution contained 120 mm Cs+ plus 10 mm TEA. A, the NMDA inward current carried by Ca2+ and Na+ influx was recorded at −70 mV; no change was detected when two currents were evoked with an interval of 1 min (left, two overlapping current traces). Pre-pulses to hyperpolarized (-80 mV) or depolarized (+40 mV) potentials completed 1 s before NMDA application did not alter the inward current (right, two overlapping current traces). The voltage protocol is shown under the current traces; the dotted line represents the 10 s duration of the pre-pulse. B, the NMDA outward current carried by Cs+ efflux was recorded at +50 mV in the external solution of normal Ca2+ and Na+; without pre-pulses, two successive recordings evoked two similar currents (left, superimposed current traces). The two currents in the middle were recorded following pre-pulses to −80 and +40 mV. Although a pre-step to −80 mV did not affect the outward current, a pre-depolarization markedly enhanced the current. Briefly switching the membrane potential from +40 to −80 mV before NMDA application eliminated the depolarization-initiated upregulation of the NMDA outward current (right, overlapping currents). Arrows below the voltage protocol diagrams mark the time points for NMDA (100 μm) and glycine (10 μm) application. Recordings were made in the same solutions and from same cells. The effect of a pre-pulse to −80 mV was tested before stepping to +40 mV with 1 min separation; the interval between episodes was 1 min. C, the bar graph summarizes the data shown in A. The inward NMDA current recorded at −70 mV was almost identical, regardless of the pre-existing membrane potential; the outward current recorded at +50 mV, however, was enhanced following a pre-depolarization (n = 7). *P < 0.05 compared with the current without a pre-pulse or that after a pulse to-80 mV.
Figure 4
Figure 4. Selective regulation of Inmda-k by prior membrane potentials
A, the isolated Inmda-k was recorded at various membrane potentials using the Ca2+-free, Na+-free external solution containing 2 μm Gd3+ and 0.5 μm TTX; the Cs+-based internal solution contained 10 mm TEA and 2 mm BAPTA (see Methods for other components in the solutions). a, control Inmda-k were evoked at membrane potentials from −80 to +40 mV at 20 mV increments; no pre-pulse was applied before NMDA application. Membrane responses to the same voltage jumps in the absence of NMDA applications are shown in d, and currents at different voltage levels are superimposed. The voltage protocol is illustrated in the line diagram below. In column b, each Inmda-k was evoked at different potentials following a hyperpolarizing pulse (10 s duration, represented by the dashed line) from a holding potential of −60 mV to −80 mV; this manipulation exerted no significant effect on Inmda-k. More hyperpolarizing pre-pulses were not tested. As shown in the line diagram below, there was a 1 s delay between the termination of the pre-pulse and the beginning of the NMDA application. Voltage-step-evoked membrane responses without NMDA application are shown in e. The Inmda-k shown in c were evoked 1 s after a depolarizing pre-pulse from −60 to +40 mV (10 s duration). Inmda-k was significantly enlarged following the pre-depolarization compared to the current generated without a pre-pulse or following a hyperpolarization. The voltage-step-triggered membrane responses in the absence of NMDA application are shown in f; the voltage protocol is illustrated at below the traces. The intra-trial interval between IV protocols in the same cell was 1 min. The short horizontal lines before the current traces show the baseline of the recordings. Except for the dashed line, the voltage diagrams at the bottom illustrate the actual time points at which the membrane potential was changed. The current traces represent similar results from six cells. B, effects of pre-depolarization on the IV relationship of Inmda-k; same voltage protocol as shown in Ac. The depolarizing pre-pulse enhanced Inmda-k and intensified the outward rectification compared with the currents recorded without a pre-pulse (n = 10 for each point). *P < 0.05 by paired t test for currents recorded in the same cells. C, internal Mg2+ blocked Inmda-k in a concentration-dependent, but voltage-independent manner (shown as a straight line at 5 mm[Mg2+]i; n = 20–50 for each point). P < 0.05 compared with 0 mm Mg2+ controls at all points.
Figure 6
Figure 6. Time-dependent regulation of Inmda-k
A, the depolarizing pre-pulse-induced upregulation of the isolated Inmda-k depended upon the duration of the pre-pulse. Longer pre-pulses from −80 to +40 mV induced larger enhancement of Inmda-k. Exponential curve fitting (a) of the duration (b) gave an approximate time constant of 1.61 s for the required duration of pre-depolarization. The single exponential decay equation It = I0e-tτ was used for the analysis (SigmaPlot, SPSS, Chicago, IL, USA), where It and I0 were the normalized amplitudes of the current at times t and 0 s, respectively. B, stepping to the negative potential of −80 from +40 mV revealed an inhibitory effect on Inmda-k. The time constant for the effect of the hyperpolarizing step was 1.97 s, as determined by exponential curve fitting (a). Inset b illustrates the voltage protocols used in these experiments; a 1 s delay was applied between terminating the pre-pulse and starting the application of NMDA. Each point represents the results from six cells.
Figure 7
Figure 7. Selective upregulation of Inmda-k by a train of brief excitatory pre-pulses
NMDA inward and outward currents were recorded in the same cells and the same solutions at −40 and +40 mV, respectively. A burst of depolarizing pulses (100 ms pulses from −40 to +40 mV at 5 Hz for 10 s) was applied and completed 1 s before NMDA applications. A, representative traces of NMDA inward current and outward currents before and after the pre-pulses in the same cell. The outward current was enhanced following one burst of pre-pulses, whereas the inward current decreased. B, membrane responses induced by the voltage steps from the holding potential of −60 up to +40 mV remained constant after the train of stimuli. Adding 2 μm Gd3+ suppressed the initial inward shifts and induced no other effect (data not shown, but see similar results in Fig. 4Ad). C, increased NMDA outward current and decreased NMDA inward current recorded with a 1 or 5 s delay after the repetitive depolarizing spikes. The membrane potential was kept at −60 mV between the trials and during the 1 or 5 s delay time. Currents were compared with their controls (dashed line) before the depolarizing pulses and are expressed as a percentage of the control value (n = 15 and 14 for the 1 and 5 s delay, respectively). * Significantly different from controls before pre-pulses (P < 0.05).
Figure 8
Figure 8. Voltage- and activity-dependent regulation of INMDA during NMDA receptor activation
NMDA inward and outward currents were recorded in different cells in normal and Na+-free external solutions, respectively. The concentration of Ca2+ was normal (2 mm) in both solutions. Since NMDA currents of opposite directions could be recorded at the identical membrane potential of −10 mV, the same depolarizing pulses (from −10 to +50 mV at 16–18 Hz for 1 s were applied during the 3 s NMDA application. Current area (see the shaded areas in A and B indicated by the arrows) was measured to reflect the time-dependent changes. A, the depolarizing pulses facilitated the desensitization of the NMDA inward current. The bar graph in B shows the significant reduction in the current area after the pulses compared with the corresponding current area of the control current (n = 4). C, the same depolarizing stimuli augmented the NMDA outward current compared with the corresponding control current area. The bar graph in D shows the control and enhanced current area during the period following depolarizing pulses (n = 6). The bar values in B and D are arbitrary numbers. * Significantly different from controls.

Similar articles

Cited by

References

    1. Alonso A, De Curtis M, Llinas R. Postsynaptic Hebbian and non-Hebbian long-term potentiation of synaptic efficacy in the entorhinal cortex in slices and in the isolated adult guinea pig brain. Proc Natl Acad Sci U S A. 1990;87:9280–9284. - PMC - PubMed
    1. Anwyl R. Permeability of the post-synaptic membrane of an excitatory glutamate synapse to sodium and potassium. J Physiol. 1977;273:367–388. - PMC - PubMed
    1. Ascher P, Nowak L. The role of divalent cations in the N-methyl-D-aspartate responses of mouse central neurones in culture. J Physiol. 1988;399:247–266. - PMC - PubMed
    1. Ballyk BA, Goh JW. Elevation of extracellular potassium facilitates the induction of hippocampal long-term potentiation. J Neurosci Res. 1992;33:598–604. - PubMed
    1. Bernard J, Lahsaini A, Massicotte G. Potassium-induced long-term potentiation in area CA1 of the hippocampus involves phospholipase activation. Hippocampus. 1994;4:447–453. - PubMed

Publication types

LinkOut - more resources