. 2003 Jul 21;198(2):201-9.
doi: 10.1084/jem.20021893. Epub 2003 Jul 14.

CD4+ T cell polarization in mice is modulated by strain-specific major histocompatibility complex-independent differences within dendritic cells

Affiliations

CD4+ T cell polarization in mice is modulated by strain-specific major histocompatibility complex-independent differences within dendritic cells

Christophe Filippi et al. J Exp Med. .

Abstract

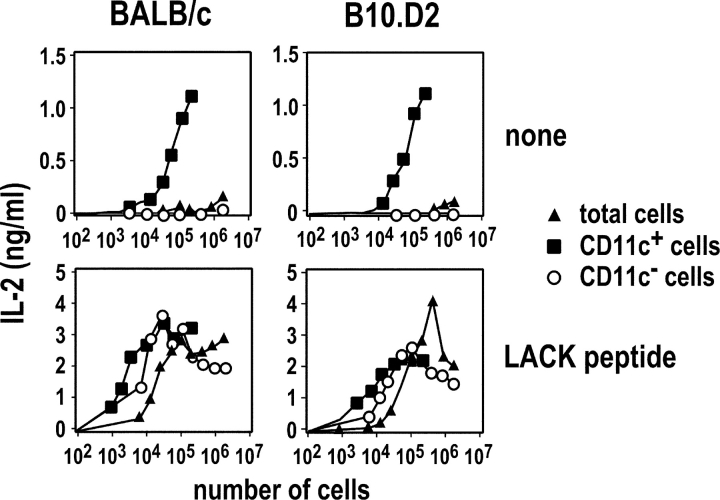
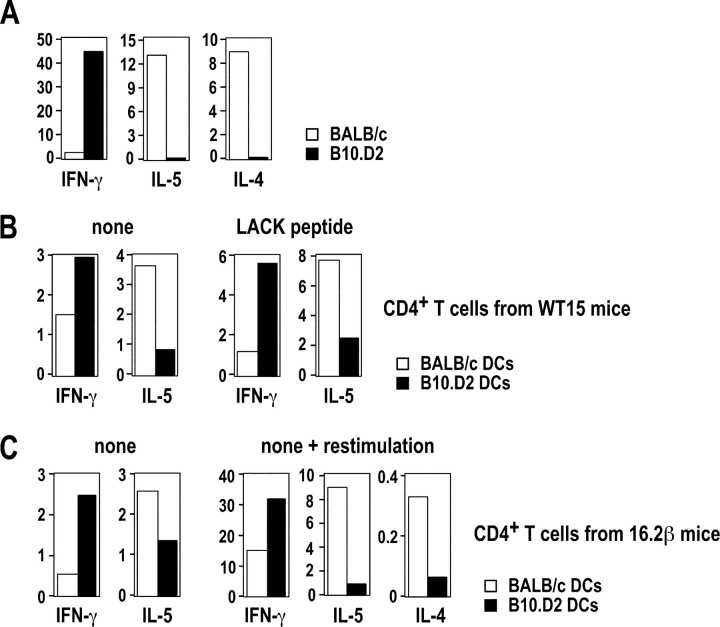
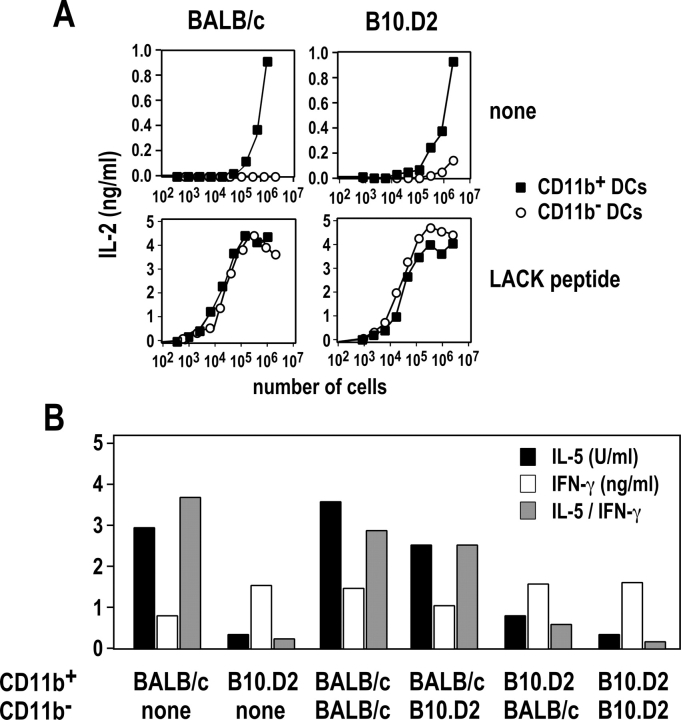
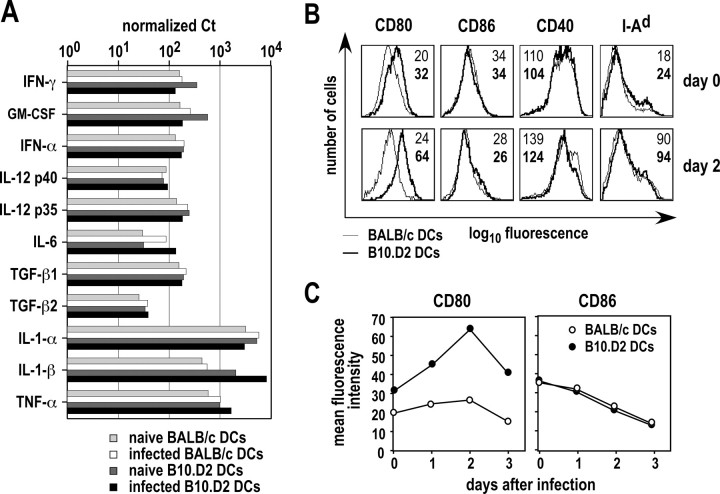
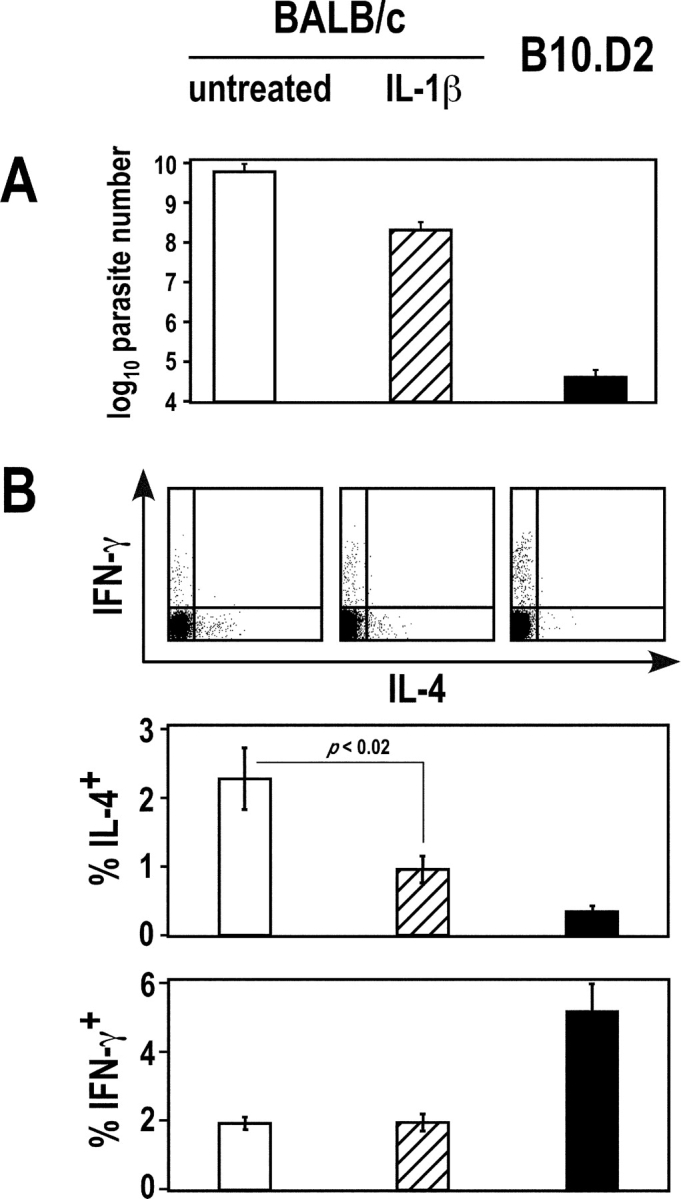
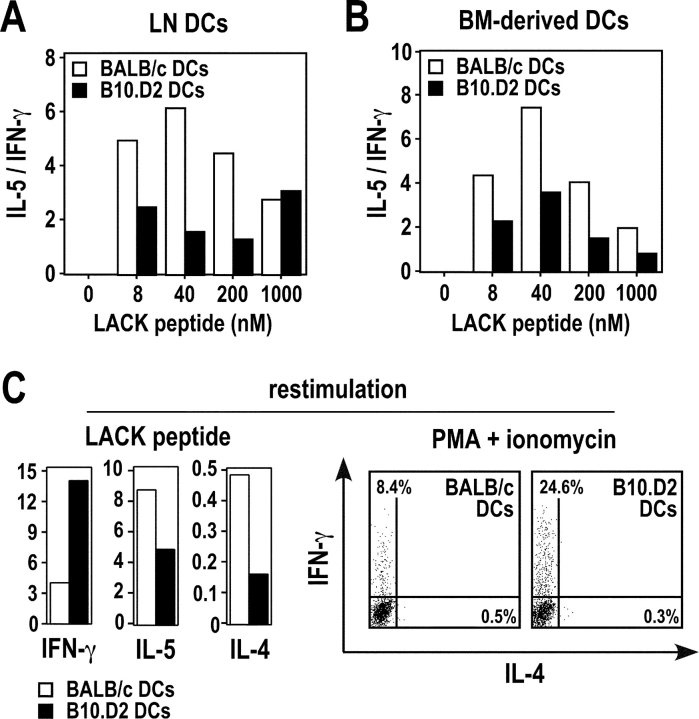
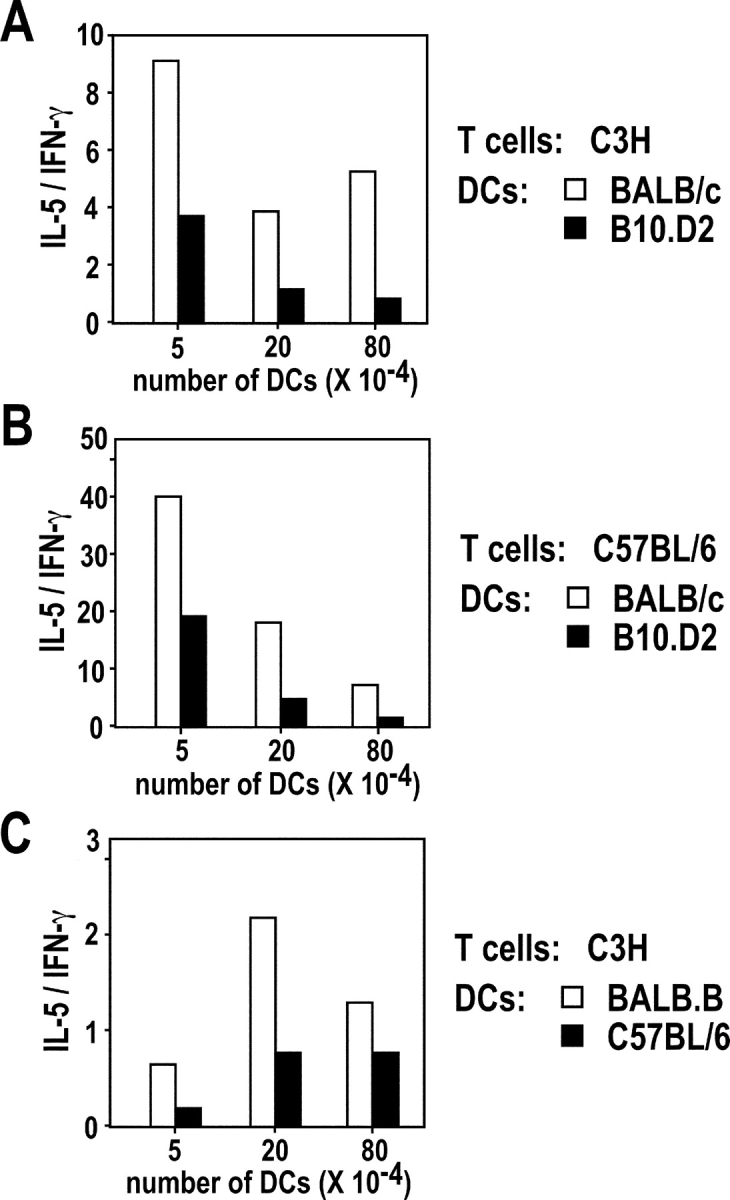
Resistance and susceptibility to Leishmania major in mice are determined by multiple genes and correlate with the preferential development of Th1 and Th2 responses, respectively. Here, we found that CD11b+ dendritic cells (DCs) prime parasite-specific CD4+ T cells in both susceptible BALB/c (H2-d) and resistant B10.D2 (H2-d) mice. However, BALB/c and B10.D2 DCs from L. major-infected mice differ in their ability to polarize naive T cells into Th1 or Th2 effector cells. This difference is cell-intrinsic, is not restricted to H2-d mice, and is observed with both parasite-specific and allospecific CD4+ T cells. Thus, strain-specific differences within CD11b+ DCs influence the ability of inbred mice to mount polarized CD4+ T cell responses.


Figures

Figure 1.
Figure 1.
MHC class II presentation of LACK by CD11c+ cells. BALB/c (left panels) and B10.D2 (right panels) mice were infected with L. major promastigotes into the hind footpads. LN cells were prepared on day 2 and depleted of CD3+ cells. Cells were either used directly (▴) or sorted into CD11c+ (▪) and CD11c (○) cells. The indicated numbers of cells were incubated with 105 LMR7.5 hybridomas without (top panels) or with (bottom panels) 1 μM of LACK peptide. Supernatants were harvested 24 h later and analyzed for IL-2 content. Data are representative of five experiments.
Figure 2.
Figure 2.
DCs from infected BALB/c and B10.D2 mice differ in their ability to polarize naive CD4+ T cells. BALB/c (□) and B10.D2 (▪) mice were infected with L. major. (A) LN CD4+ T cells were purified 5 wk after infection and 5 × 10⁵ cells were incubated with SLA (30 μg/ml) and 2 × 10⁶ mitomycin C–treated syngeneic splenocytes. Supernatants were analyzed after 48 h for IFN-γ, IL-5, and IL-4 contents by ELISA. Data show the amounts of IFN-γ (ng/ml), IL-5 (U/ml), and IL-4 (ng/ml). (B and C) LN CD11c+ cells were purified on day 2. (B) CD44low CD62Lhigh CD4+ T cells were purified from F1 (BALB/c × B10.D2) WT15 transgenic mice and 5 × 10⁵ cells were incubated with 1.2 × 10⁵ CD11c+ cells without (left panel) or with (right panel) 1 μM of LACK peptide. Supernatants were harvested on day 6 (left panel) or on day 3 (right panel) and analyzed for IFN-γ and IL-5 contents. Data are representative of six experiments and show the amounts of IFN-γ (ng/ml) and IL-5 (U/ml). (C) CD44low CD62Lhigh CD4+ T cells were purified from F1 (BALB/c × B10.D2) 16.2β transgenic mice and 1.5 × 10⁶ cells were incubated with 3 × 10⁵ CD11c+ cells without LACK peptide. (left) Supernatants were harvested on day 6 and analyzed for IFN-γ and IL-5 contents. Live cells were purified and restimulated with mitomycin C–treated F1 splenocytes and 1 μM of LACK peptide. (right) Supernatants were harvested on day 3 and analyzed for IFN-γ, IL-4, and IL-5 contents. Data are representative of three experiments and show the amounts of IFN-γ (ng/ml), IL-5 (U/ml), and IL-4 (ng/ml).
Figure 3.
Figure 3.
MHC class II presentation of LACK by CD11b+ DCs. BALB/c (left panels) and B10.D2 (right panels) mice were injected with L. major promastigotes into the hind footpads. LN cells were prepared on day 2 and depleted of CD3+ cells. CD11c+ cells were purified by MACS and stained with anti-CD11b and anti-CD11c mAb. (A) CD11b+ (▪) and CD11b (○) DCs were sorted by flow cytometry, and the indicated numbers of cells were incubated with 105 LMR7.5 hybridomas without (top panels) or with (bottom panels) 1 μM of LACK peptide. Supernatants were harvested 24 h later and analyzed for IL-2 content. Data are representative of five experiments. (B) CD11b+ and CD11b DCs were sorted by flow cytometry, and mixtures of these cells (6 × 10⁴ cells of the indicated subset), or 1.2 × 10⁵ CD11b+ cells alone, were incubated with 5 × 10⁵ CD44low CD62Lhigh CD4+ T cells from F1 (BALB/c × B10.D2) WT15 transgenic mice. Supernatants were harvested on day 6 and analyzed for IFN-γ (white bars) and IL-5 (black bars) contents. The IL-5/IFN-γ ratio (gray bars) was calculated for each sample. Data are representative of three experiments.
Figure 4.
Figure 4.
Cytokine mRNA and costimulatory molecules expressed by BALB/c and B10.D2 DCs. Mice were infected or not with L. major promastigotes. (A) LNs were harvested on day 2 and CD11b+ CD11c+ cells were purified by flow cytometry. mRNA levels for the indicated cytokines were measured using Real Time RT-PCR. Values are expressed as the number of Ct for each cytokine mRNA after normalization to ubiquitin mRNA for infected BALB/c (white bars) and B10.D2 (black bars) mice, and for PBS-injected BALB/c (light gray bars) and B10.D2 (dark gray bars) mice. Data are representative of three experiments. (B and C) LN CD11c+ were purified at the indicated times after infection and cells were analyzed by flow cytometry after staining with anti-CD11b, anti-CD11c, and either anti-CD80, anti-CD86, anti-CD40, or anti-I-Ad mAb. (B) Typical flow cytometry profiles are shown after gating on CD11b+ DCs for BALB/c (thin lines) and B10.D2 (thick lines) mice. Data show the mean fluorescence intensity (MFI) expressed as geometric mean for BALB/c (plain) and B10.D2 (bold) mice. (C) Surface levels of CD80 (left panel) and CD86 (right panel) were measured at the indicated times after infection in BALB/c (○) and B10.D2 (•) mice. Data show MFI expressed as geometric mean.
Figure 5.
Figure 5.
Effect of IL-1β on T cell polarization and parasite load. BALB/c mice (five mice per group) were treated or not with recombinant murine IL-1β and infected with L. major, together with control B10.D2 mice. Mice were killed 5 wk later. (A) Parasite loads were measured in draining LN. Data show mean ± SEM for untreated BALB/c mice (empty bars), IL-1β–treated BALB/c mice (dashed bars), and B10.D2 mice (filled bars). (B) LN cells were stimulated with PMA and ionomycin, and further analyzed by flow cytometry after surface staining with anti-CD4 mAb and intracellular staining with anti-IL-4 and anti-IFN-γ mAb. Data show representative FACS® profiles after gating on CD4+ T cells (top panels), and the frequency of IL-4– and IFN-γ–secreting cells (mean ± SEM) for untreated BALB/c mice (empty bars), IL-1β-treated BALB/c mice (dashed bars), and B10.D2 mice (filled bars; bottom panels). Statistical analysis was performed using Student's t test.
Figure 6.
Figure 6.
DCs from naive BALB/c and B10.D2 mice differ in their ability to polarize CD4+ T cells. CD11c+ cells were purified from the popliteal LNs (A and C) or generated from the bone marrow (B) of naive BALB/c (□) and B10.D2 (▪) mice. 2 × 10⁵ cells were pulsed for 18 h with the indicated concentrations (A and B) or 50 nM (C) of LACK peptide, and further incubated with 5 × 10⁵ CD44low CD62Lhigh CD4+ T cells from F1 (BALB/c × B10.D2) WT15 TCR transgenic mice. (A and B) Supernatants were harvested on day 3 and analyzed for IFN-γ and IL-5 contents. Data are representative of six and three experiments, respectively, and show the ratios between IL-5 (U/ml) and IFN-γ (ng/ml). (C) Cells were recovered on day 3 and restimulated with 2 μM of LACK peptide in the presence of syngeneic splenocytes. Supernatants were analyzed on day 3 for IFN-γ, IL-4, and IL-5 contents (left panels). Data show the amounts of IFN-γ (ng/ml), IL-5 (U/ml), and IL-4 (ng/ml). Cells were restimulated with PMA and ionomycin, stained with anti-CD4 mAb and analyzed by flow cytometry for intracellular staining of IFN-γ and IL-4 (right panels). Data are representative of three experiments and show FACS® profiles after gating on CD4+ T cells.
Figure 7.
Figure 7.
DCs from different strains of mice differ in their ability to polarize allospecific CD4+ T cells. (A and B) CD11c+ cells were purified from the popliteal LN of naive BALB/c (□) or B10.D2 (▪) mice and the indicated numbers of cells were incubated with 5 × 10⁵ CD44low CD62Lhigh CD4+ T cells from C3H (A) or C57BL/6 (B) mice. Supernatants were harvested on day 3 and analyzed for IFN-γ and IL-5 contents. Data are representative of four experiments and show the ratios between IL-5 (U/ml) and IFN-γ (ng/ml). (C) CD11c+ cells were purified from the popliteal LN of naive BALB.B (□) or C57BL/6 (▪) mice and the indicated numbers of cells were incubated with 5 × 10⁵ CD44low CD62Lhigh CD4+ T cells from C3H mice. Supernatants were harvested on day 3 and analyzed for IFN-γ and IL-5 contents. Data show the ratios between IL-5 (U/ml) and IFN-γ (ng/ml) in a representative out of two experiments.

Comment in

References

    1. Reiner, S.L., and R.M. Locksley. 1995. The regulation of immunity to Leishmania major. Annu. Rev. Immunol. 13:151–177. - PubMed
    1. Beebe, A.M., S. Mauze, N.J. Schork, and R.L. Coffman. 1997. Serial backcross mapping of multiple loci associated with resistance to Leishmania major in mice. Immunity. 6:551–557. - PubMed
    1. Roberts, L.J., T.M. Baldwin, J.M. Curtis, E. Handman, and S.J. Foote. 1997. Resistance to Leishmania major is linked to the H2 region on chromosome 17 and to chromosome 9. J. Exp. Med. 185:1705–1710. - PMC - PubMed
    1. Coffman, R.L., and A.M. Beebe. 1998. Genetic control of the T cell response to Leishmania major infection. Adv. Exp. Med. Biol. 452:61–66. - PubMed
    1. Roberts, L.J., T.M. Baldwin, T.P. Speed, E. Handman, and S.J. Foote. 1999. Chromosomes X, 9, and the H2 locus interact epistatically to control Leishmania major infection. Eur. J. Immunol. 29:3047–3050. - PubMed

Publication types