. 2003 Jul 21;198(2):349-60.
doi: 10.1084/jem.20030220. Epub 2003 Jul 14.

Mutation in fas ligand impairs maturation of thymocytes bearing moderate affinity T cell receptors

Affiliations

Mutation in fas ligand impairs maturation of thymocytes bearing moderate affinity T cell receptors

Tamar E Boursalian et al. J Exp Med. .

Abstract

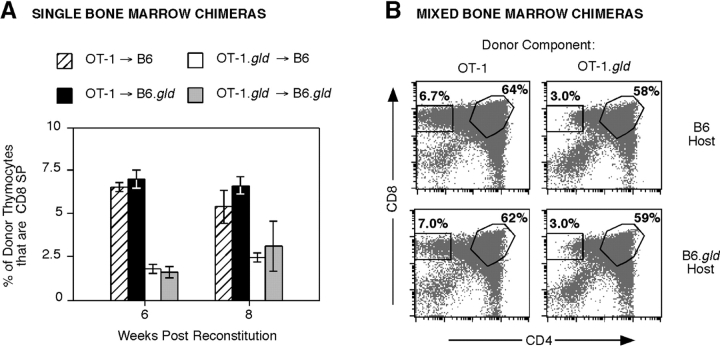
Fas ligand, best known as a death-inducer, is also a costimulatory molecule required for maximal proliferation of mature antigen-specific CD4+ and CD8+ T cells. We now extend the role of Fas ligand by showing that it can also influence thymocyte development. T cell maturation in some, but not all, strains of TCR transgenic mice is severely impaired in thymocytes expressing mutant Fas ligand incapable of interacting with Fas. Mutant Fas ligand inhibits neither negative selection nor death by neglect. Instead, it appears to modulate positive selection of thymocytes expressing both class I- and class II-restricted T cell receptors of moderate affinity for their positively selecting ligands. Fas ligand is therefore an inducer of death, a costimulator of peripheral T cell activation, and an accessory molecule in positive selection.


Figures

Figure 1.
Figure 1.
Defects in FasL alter thymocyte maturation in OT-1 TCR Tg mice. (A) CD4/CD8 profiles of thymocytes from OT-1 (left) and OT-1.gld (middle) mice are compared. Gates designated by letters in the dot plots represent thymocyte subpopulations described in the table (right), listing percentages of thymocytes in each compartment. Bold numbers highlight major differences observed. (B) Percentages of thymocytes in the indicated subcompartments are shown for individual animals. Left panels: OT-1 (circles, n = 8) are compared with OT-1.gld (triangles, n = 7) and OT-1.lpr (diamonds, n = 5) mice. Right panels: B6 (circles, n = 4) are compared with B6.gld mice (triangles, n = 4). Means are designated by solid bars. Note changes in y-axis scales for DP thymocytes. (C) Vα2 (top) and CD24 (bottom) expression in DP, CD8+CD4dull (transitional cells along the CD8 lineage), and CD8 SP thymocytes is compared between OT-1 (open histograms, thick lines) and OT-1.gld mice (light gray histograms), and in CD8 SP thymocytes between OT-1 and two OT-1.lpr mice (rightmost panels). OT-1.lpr 1 (open histograms) had 3.5% CD8 SP, while OT-1.lpr 2 (dark gray histograms) had 6.5% CD8 SP remaining.
Figure 2.
Figure 2.
FasL RNA and surface protein are expressed by wild-type OT-1 and B6 thymocytes. (A) RT-PCR was performed to assess FasL expression in thymocytes from wild-type OT-1 and B6 mice sorted on the basis of CD4 and CD8 expression, using gates shown in Fig. 1 A. Testis was used as a FasL-positive control. Stroma represents thymic capsule debris treated with anti–Thy-1 plus complement to remove contaminating thymocytes. Serial dilutions of cDNA from each subpopulation were amplified in HPRT-specific PCR reactions to titrate relative amounts of cDNA. In FasL PCR reactions, equivalent amounts of cDNA were amplified for testis, stroma, CD4 SP (B6 and OT-1), and DN (B6). 3-fold more cDNA was required for amplification of DN (OT-1), 6-fold for DP (B6), 9-fold for DP (OT-1) and CD8 SP (OT-1), and 18-fold for CD8 SP (B6). FasL PCR products were transferred to hybridization membranes and probed with end-labeled oligonucleotide. (B) Thymocytes from wild-type B6 (left panels) and OT-1 (right panels) mice were stained for CD4 and CD8 by conventional methods and for FasL by EAS. FasL expression (gray histograms) is compared with isotype control (open histograms) for gated DN, DP, CD8 SP, and CD4 SP thymocytes. Numbers represent the percentage of FasL+ cells falling within the indicated markers.
Figure 3.
Figure 3.
The defect in OT-1.gld thymocyte maturation is T cell autonomous and cannot be rescued by neighboring wild-type thymocytes. (A) Single BM chimeras were analyzed 4, 6, and 8 wk after reconstitution; only the latter two time points are shown. Thymocytes were stained for CD4 and CD8 and mean percentages of donor CD8 SP cells were calculated for each chimera type (striped bars = OT-1 → B6; black bars = OT-1 → B6.gld; open bars = OT-1.gld → B6; gray bars = OT-1.gld → B6.gld). Error bars represent the range of two data points for each group. (B) Mixed BM chimeras were analyzed at 4, 6, and 8 wk after reconstitution; results from week 8 are shown. Top panels: CD4/CD8 profiles of thymocytes from the two different donor types (OT-1 or OT-1.gld) within a single B6 host. Bottom panels: CD4/CD8 profiles of thymocytes from the two different donor types (OT-1 or OT-1.gld) within a single B6.gld host. Dot plots are gated on donor type using Ly5 allelic differences to distinguish donors from each other and the host. Percentages of CD8 SP thymocytes contained within each donor component are shown. Data are representative of three experiments; n = 2–4 for each group.
Figure 4.
Figure 4.
FasL deficiency does not affect negative selection or death by neglect. (A) Comparison between CD4/CD8 profiles of thymocytes from OT-1 and OT-1.gld mice on an H-2d (left panels) or an H-2Kbm1 background (right panels). (B) OT-1 mice on an H-2Kb background (left of each panel; OT-1 n = 8, OT-1.gld n = 7) were compared with those on an H-2d (middle of each panel; OT-1 and OT-1.gld n = 4) and an H-2Kbm1 (right of each panel; OT-1 and OT-1.gld n = 4) background. For each strain, percentages of CD8 SP (left panel), DP (middle panel), and total thymocytes (right panel) are shown for individual OT-1 (circles) and OT-1.gld mice (triangles). Means are designated by solid bars. Note change in y-axis scale for H-2Kbm1 total thymocytes.
Figure 5.
Figure 5.
Maturation of thymocytes expressing some, but not all, TCRs is influenced by FasL. (A) Percentages of thymocyte subpopulations based on CD4/CD8 expression were compared between wild-type (circles) and gld H-2b mice (triangles) Tg for the P14 TCR (left panel; wild-type and gld n = 4) and the H-Y TCR (right panel; wild-type n = 2, gld n = 3). Means are designated by solid bars. (B) Left: numbers of total and CD4 SP thymocytes were compared between AND (circles; n = 6) and AND.gld (triangles; n = 6) TCR Tg H-2b mice. Means are designated by solid bars. Right: Vβ3 (top) and CD24 (bottom) expression were compared between wild-type (open histograms) and gld (gray histograms) CD4 SP thymocytes from AND TCR Tg mice. (C) Thymocytes from wild-type P14 (top row), H-Y (second row), and AND on H-2b (third row), and H-2k backgrounds (bottom row) mice were stained for CD4, CD8, and FasL as in Fig. 2 B. FasL expression (gray histograms) is compared with isotype control (open histograms) for gated DN (left histograms) and DP (middle histograms) thymocytes in all strains, CD8 SP in P14 and H-Y, and CD4 SP in AND (right histograms) mice. Numbers represent the percentage of FasL+ cells falling within the indicated markers.
Figure 6.
Figure 6.
Increasing the strength of the positive selection signal bypasses the need for FasL during thymocyte development. (A) CD5 expression is compared between wild-type AND TCR Tg mice on H-2b (open histograms) and H-2k backgrounds (gray histograms). Histograms represent DP Vβ3hi (left) or CD4 SP Vβ3hi thymocytes (right); mean fluorescence intensity (MFI) for each is shown. (B) AND TCR Tg mice on H-2b (wild-type and gld n = 6), H-2b/H-2k heterozygous (wild-type and gld n = 4) and H-2k backgrounds (wild-type and gld n = 4) were compared. Numbers of total (left panel) and CD4 SP thymocytes (right panel) are shown for AND (circles) and AND.gld (triangles). Means are designated by solid bars. (C) Vβ3 (left) and CD24 (right) expression were compared between wild-type (open histograms) and gld (gray histograms) CD4 SP thymocytes from AND TCR Tg mice on an H-2k background.
Figure 7.
Figure 7.
FasL engagement likely enhances rather than represses positive selection. (A) TCR expression levels on total DP thymocytes from AND and AND.gld mice on the H-2b background are dissimilar to those on the H-2k background. Vβ3 expression is compared between wild-type (open histograms) and gld (gray histograms) AND mice on the H-2b (top panel) and H-2k backgrounds (bottom panel). (B) CD5 levels on thymocyte subpopulations do not correlate with expression of wild-type FasL. CD5 expression is shown for DP TCRhi and CD4 SP TCRhi thymocytes from wild-type (open histograms, thick lines) and gld (gray histograms or open histograms, dotted lines) AND mice on the H-2b (top panels) and H-2k backgrounds (middle panels), and OT-1 mice (bottom panels). MFI for each is shown. (C) Model depicting the correlation between thymocyte sensitivity to FasL costimulation and avidity of the TCR for its selecting ligand. Thymocytes expressing TCRs of very low avidity for selecting ligands die by neglect (left) while those expressing TCRs with the highest avidity for selecting ligands die by negative selection (right). Thymocytes expressing TCRs with avidities between these two extremes will be positively selected. Within this range, thymocytes expressing TCRs with lower avidity, such as H-Y, or those expressing TCRs with sufficiently high avidity (P14 or AND selected on I-Ek) are not influenced by FasL costimulation during T cell development. Thymocytes expressing TCRs with intermediate avidity, such as OT-1 and AND selected on I-Ab, will benefit from the costimulatory boost delivered by FasL to develop into mature SP thymocytes (middle, gray area).

Similar articles

Cited by

References

    1. von Boehmer, H. 1994. Positive selection of lymphocytes. Cell. 76:219–228. - PubMed
    1. Jameson, S.C., K.A. Hogquist, and M.J. Bevan. 1995. Positive selection of thymocytes. Annu. Rev. Immunol. 13:93–125. - PubMed
    1. Godfrey, D.I., and A. Zlotnik. 1993. Control points in early T-cell development. Immunol. Today. 14:547–553. - PubMed
    1. von Boehmer, H., and H.J. Fehling. 1997. Structure and function of the pre-T cell receptor. Annu. Rev. Immunol. 15:433–452. - PubMed
    1. Nossal, G.J.V. 1994. Negative selection of lymphocytes. Cell. 76:229–239. - PubMed

Publication types