. 2003 Aug;23(15):5174-85.
doi: 10.1128/MCB.23.15.5174-5185.2003.

Direct repression of splicing by transformer-2

Affiliations

Direct repression of splicing by transformer-2

Dawn S Chandler et al. Mol Cell Biol. 2003 Aug.

Abstract

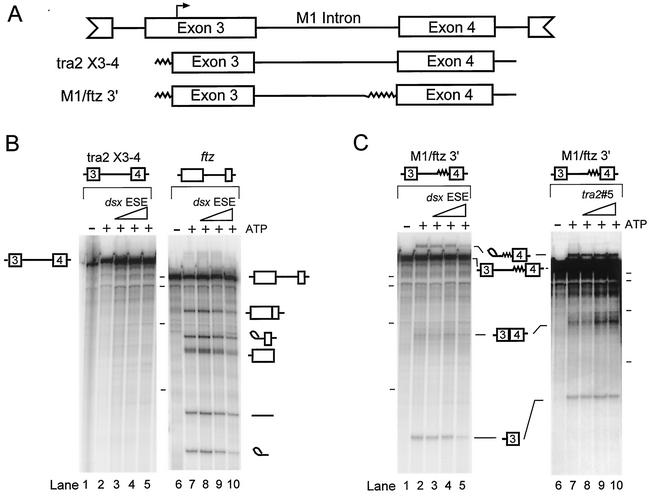
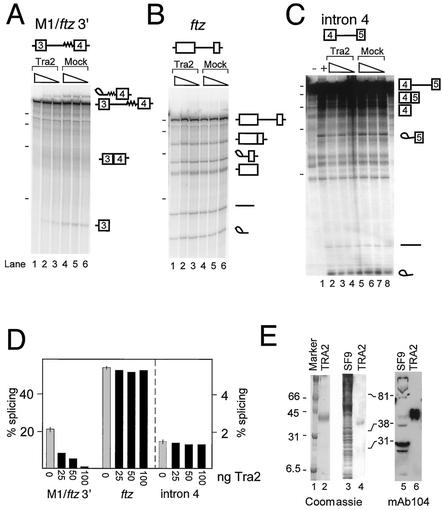
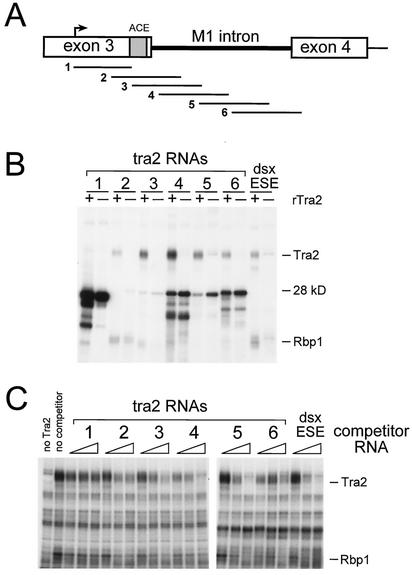
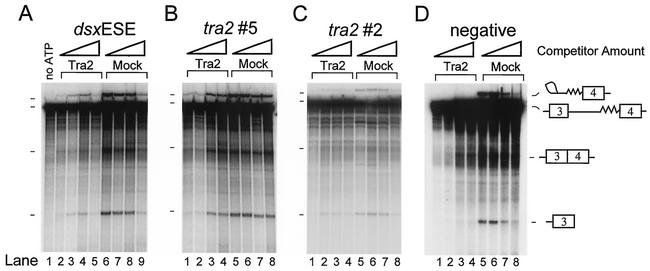
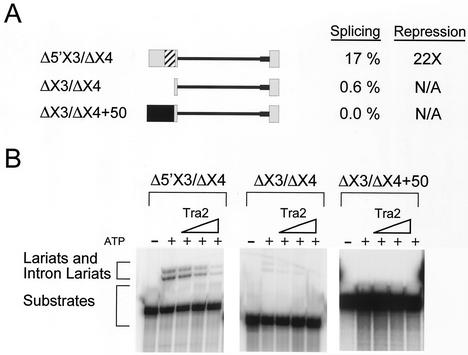
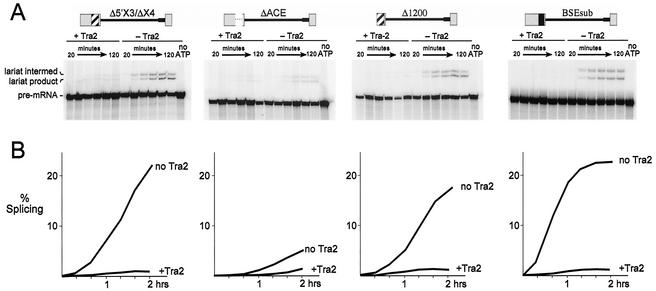
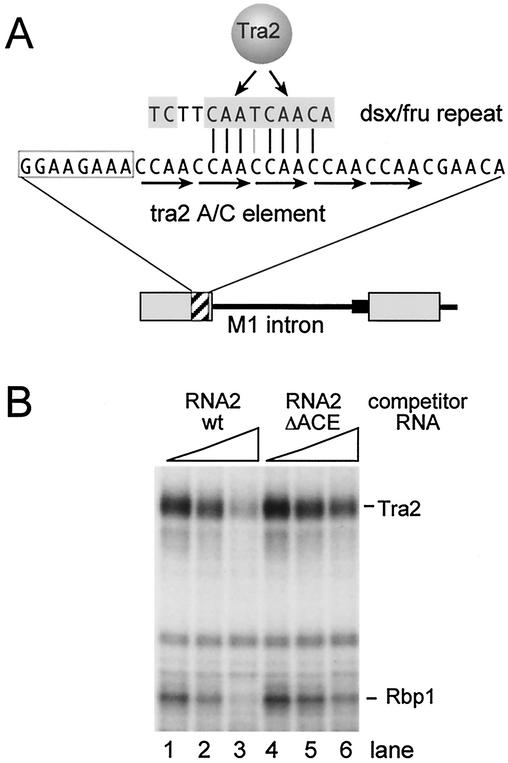
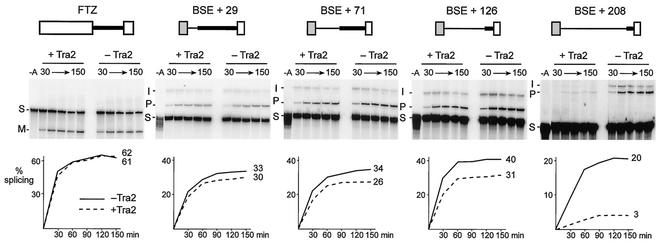
The Drosophila melanogaster sex determination factor Tra2 positively regulates the splicing of both doublesex (dsx) and fruitless (fru) pre-mRNAs but negatively affects the splicing of the M1 intron in tra2 pre-mRNA. Retention of the M1 intron is known to be part of a negative-feedback mechanism wherein the Tra2 protein limits its own synthesis, but the mechanism responsible for accumulation of M1-containing RNA is unknown. Here we show that the recombinant Tra2 protein specifically represses M1 splicing in Drosophila nuclear extracts. We find that the Tra2 protein binds directly to several sites in and near the M1 intron and that, when Tra2 binding is competed with other RNAs, the splicing of M1 is restored. Mapping the RNA sequences functionally required for M1 repression identified both a 34-nucleotide (nt) A/C-rich sequence immediately upstream of the M1 5' splice site and a region within the intron itself. The AC-rich sequence is largely composed of a repeated 4-nt sequence that also forms a subrepeat within the repeated 13-nt splicing enhancer elements of fru and dsx RNAs. Although required for repression, the element also enhances M1 splicing in the absence of Tra2. We propose that Tra2 represses M1 splicing by interacting with multiple sequences in the pre-mRNA and interfering with enhancer function.


Figures

FIG. 1.
FIG. 1.
In vitro splicing of Tra2 substrates in Schneider 2 nuclear extracts. (A) Schematic representing the tra2 transcripts that were used in the in vitro splicing assays. Boxes, tra2 exons; lines, tra2 intron sequences; jagged line, heterologous sequences, including the ftz 3′ splice site, that were included in these splicing substrates. The top line shows the region of Tra2 pre-mRNA around M1. Arrow, position of the male germ line transcription start site. (B) Tra2 X3-4, an RNA substrate from the native tra2 gene, was labeled with 32P and used for in vitro splicing as shown in lanes 1 through 5. As a positive control a labeled RNA containing the intron and flanking exons from the Drosophila ftz gene was also subjected to splicing reactions under the same conditions (lanes 6 through 10). Lanes 1 and 6, control reactions without ATP showing no detectable splicing; lanes 2 and 7, reactions carried out with the native M1 intron only; lanes 3 to 5 and 8 to 10, reactions carried out in the presence of 0.5, 2.5, and 12.5 pmol, respectively (triangles), of unlabeled RNA from the dsx ESE. Products from the splicing reaction were resolved on denaturing acrylamide-urea gels. Reaction input pre-mRNAs, intermediates, and products are indicated at the side of each gel. The positions of radiolabeled in vitro-transcribed RNA molecular weight markers run on the same gel (dashes) correspond to 500, 400, 300, and 200 nt from top to bottom. (C) Similar splicing reactions were carried out on tra2 RNA substrates in which the native 3′ splice site region was replaced with the 3′ splice site of the ftz gene (M1/ftz 3′). Lanes 1 and 6, control reactions without ATP. Splicing was carried out in the presence of 0, 0.5, 2.5- and 12.5 pmol of unlabeled dsx ESE RNA (lanes 2 to 5, respectively) or an RNA from within the M1 intron (RNA 5 in Fig. 3A; lanes 7 to 10, respectively).
FIG. 2.
FIG. 2.
Repression of M1/ftz 3′ splicing by recombinant Tra2 protein. In vitro splicing assays were performed with S2 nuclear extracts on the 32P-labeled in vitro-transcribed RNAs depicted above each reaction set. In each set, splicing reactions were carried out in the presence of 100, 50, and 25 ng of recombinant Tra2 protein or in buffer controls without Tra2 (mock) (triangles indicate amounts of recombinant Tra2 and buffer). The positions of reaction intermediates and products are shown schematically at the right. The positions of radiolabeled in vitro-transcribed RNA molecular weight markers run on the same gel (dashes) correspond to 500, 400, 300, and 200 nt from top to bottom. In panel C, the position of the 100-nt band is also indicated. (A) Reactions carried out on M1/ftz 3′. The lariat products comigrate with the pre-mRNA on this gel. (B) Splicing reactions showing that the ftz intron is not repressed by recombinant Tra2. (C) Splicing reactions carried out on inefficiently spliced intron 4 of tra2, which is not regulated by the Tra2 protein in vivo. Lanes 1 and 2, control reactions without and with, respectively, ATP. (D) Quantitation of the splicing reactions shown in panels A to C. Grey bars, average percentages of splicing (products plus intermediates) for the three mock reactions (error bars, ranges of values); black bars, percentages of splicing reaction mixtures containing various amounts of Tra2 protein. Note that the scale for reactions with intron 4, shown to the right of the dashed line, is different from that for M1/ftz and ftz. (E) To demonstrate the degree of purity of the recombinant Tra2 protein used in the above assays, 3.5 μg of Tra2 was loaded onto a SDS-12.5% polyacrylamide gel and stained with Coomassie blue (lane 2). To further test if the purified Tra2 protein was not contaminated with SR proteins, whole-cell lysate from SF9 cells and 1 μg of Tra2 were run in duplicate on separate SDS-12.5% polyacrylamide gels and either stained with Coomassie blue (lanes 3 and 4) or electroblotted and probed with MAb 104 (lanes 5 and 6).
FIG. 3.
FIG. 3.
UV cross-linking of Tra2 with sequences near and within the M1 intron. Multiple RNAs spanning the M1 intron of tra2 were used in cross-linking experiments to determine the site of Tra2 protein binding. (A) The tra2 RNA segments used for cross-linking. The location of the ACE in exon 3 is shown. Arrow, position of the male germ line transcription start site. (B) UV cross-linking was performed with the radiolabeled tra2 RNAs depicted in panel A or a 188-nt RNA from the dsx ESE. Cross-linked proteins after label transfer and RNase digestion are resolved on an SDS-PAGE gel. The dsx RNA used in this experiment contains regulatory elements that have previously been shown to bind to Tra2. The RNAs used for cross-linking are indicated above each set of reactions. Cross-linking was performed in splicing-competent S2 nuclear extracts and in the presence (+) or absence (−) of recombinant Tra2 (100 ng). The position of the 28-kDa protein and the mobilities of Tra2 and endogenous Rbp1 proteins, as judged by Western blotting, are indicated. (C) Titration-competition cross-linking experiments performed using the radiolabeled dsx ESE RNA under splicing conditions in the presence of S2 nuclear extract supplemented with 100 ng (3 pmol) of Tra2 protein. Reactions in which recombinant Tra2 or competitor RNA was omitted are shown in the first and second lanes, respectively. In the remaining lanes, increasing amounts of various unlabeled competitor RNAs were added (0.5, 2.5, and 12.5 pmol), as indicated by the triangles.
FIG. 4.
FIG. 4.
Competition of Tra2 binding restores M1 splicing. In vitro splicing assays performed on 32P-labeled M1/ftz 3′ RNA in the presence (Tra2) or absence (Mock) of repressive amounts (3 pmol) of unlabeled recombinant Tra2 protein and RNA competitors are shown. Splicing precursors, intermediates, and products were resolved on denaturing polyacrylamide-urea gels, and their mobilities are indicated. The lariat intron product is not resolved from the pre-mRNA. (A) Competitions with the dsx ESE RNA in increasing amounts (0, 0.5, 2.5, and 12.5 pmol; triangles). Splicing is restored at moderate competitor concentrations (lanes 3 and 4), but the highest concentration of competitor RNA (lanes 5 and 9) caused nonspecific repression of splicing (compare control lanes 6 to 9). Lane 1 shows a reaction in which no ATP, Tra2, or competitors were added. (B) A similar set of reactions were carried out with RNA 5 (Fig. 3A) from within the M1 intron. Restoration of splicing is evident at the two highest concentrations of competitor (compare lane 1 to lanes 3 and 4). (C) A similar set of reactions carried out with RNA 2, which spans part of exon 3 and the 5′ end of the intron. Restoration of splicing can be seen by comparing lane 1 to lanes 2 to 4. Again, a nonspecific inhibition of splicing by high concentrations of the competitor was observed in lane 4 compared to lanes 5 to 8. (D) Competition with the same molar amounts of the unlabeled 207-nt negative-control RNA derived from sequences in dsx RNA outside of the enhancer (see Materials and Methods). No restoration of M1 splicing was observed (lanes 2 to 4).
FIG. 5.
FIG. 5.
Identification of sequences in exon 3 required for M1 splicing. (A) RNAs used for in vitro splicing assays. Boxes, exons; lines, M1 intron; thick line, substituted 3′ splice site region from ftz RNA; striped box in exon 3, position of the ACE. Δ5′X3/ΔX4 includes 58 nt from the promoter-distal end of exon 3, the M1 intron, and the first 24 nt of exon 4, while ΔX3/ΔX4 contains only the last 8 nt of exon 3, M1, and the first 24 nt of exon 4. ΔX3/ΔX4+50 contains an additional 50 nt of plasmid sequences (black box). The in vitro splicing efficiencies as a percentage of products and intermediates and the amounts of repression observed when maximum Tra2 protein is added (3 pmol) are indicated to the right. (B) Lariat products and intermediates from in vitro splicing reactions performed on the constructs in panel A in the presence of increasing amounts of Tra2 (0.5, 2.5, and 12.5 pmol). Control reactions without added Tra2 both with (+) and without ATP (−) are also shown for each substrate.
FIG. 6.
FIG. 6.
A splicing enhancer is required for normal levels of basal splicing and repression. Two-hour time course splicing assays were performed on the various substrates with (+ Tra2) and without (− Tra2) repressor, and the results of these reactions were quantified. (A) The substrates used are schematized at the top. Striped box in exon 3, ACE. This 34-nt element (Fig. 7) is deleted in the ΔACE substrate, which is otherwise identical to Δ5′X3/ΔX4. The substitution of the BSE from SV40 is indicated by a black box at the same position in the substrate BSEsub. The Δ1200 RNA lacks all sequences upstream of the ACE. For the time course reactions shown, each lane corresponds to aliquots removed from the splicing reaction at 20-min intervals. Input pre-mRNA and lariats (intermediates and products) are denoted at the left. Control reactions without ATP showed no detectable splicing after 120 min. (B) The percentage of splicing indicated corresponds to the percentage of signal from all products and intermediates relative to the total signal.
FIG. 7.
FIG. 7.
The ACE resembles sequences in the dsx and fru splicing enhancers, and its deletion reduces Tra2 binding. (A) Schematic showing the sequence and location of the tra2 ACE (striped box) and its relationship to the repeated enhancer elements found in dsx and fru RNA. The five CAAC repeats are underlined with arrows. Top arrows, sites in the 13-nt dsx repeat sequence of site-specific cross-linking to Tra2. (B) UV cross-linking was performed on the 188-nt dsx ESE fragment in the presence of splicing-competent Drosophila nuclear extract, 3 pmol of recombinant Tra2, and increasing amounts of RNA competitors (0.5, 2.5, and 12.5 pmol). The position of RNA 2 is shown in Fig. 3A. RNA 2 ΔACE contains a precise deletion of the 34-nt ACE but is otherwise identical. Rbp1 binding to the dsx ESE is dependent on Tra2 binding (Fig. 3B) and is reduced when Tra2 is competed (lane 3). Note that, although RNA 2 competition affects Tra2 and Rbp1, other cross-linking bands are unaffected. wt, wild type.
FIG. 8.
FIG. 8.
Specific M1 intron sequences also promote Tra2-dependent repression. Schematic drawings of different splicing substrates are shown at the top. Grey boxes, BSE; open boxes, exon sequences derived from the ftz gene; thin lines, sequences derived from the M1 intron; thick lines, sequences derived from the ftz intron. Below each substrate are shown time courses of splicing reactions carried out with (+ Tra2) and without (− Tra2) the recombinant Tra2 protein. Quantitation of these reactions is shown in the graph below each gel. For simplicity not all products and intermediates are shown, but quantitation represents the total percentage of all products and intermediates detected. The positions of different RNAs are indicated beside the gels as splicing substrates (S), spliced products (M), lariat intermediates (I), and lariat intron products (P). Control lanes of 150-min reactions without ATP (lanes −A) are also shown for each substrate. The maximum percentages of products entering splicing are indicated to the right of each graph. No repression was observed with the ftz substrate, indicating that Tra2 does not have general repressive effects on splicing. Over sixfold repression (20 versus 3% splicing) was observed with BSE+208, but other substrates containing M1 sequences were repressed only slightly (BSE+71, BSE+126, and BSE+29).

Similar articles

Cited by

References

    1. Amrein, H., T. Maniatis, and R. Nothiger. 1990. Alternatively spliced transcripts of the sex-determining gene tra-2 of Drosophila encode functional proteins of different size. EMBO J. 9:3619-3629. - PMC - PubMed
    1. Ashiya, M., and P. J. Grabowski. 1997. A neuron-specific splicing switch mediated by an array of pre-mRNA repressor sites: evidence of a regulatory role for the polypyrimidine tract binding protein and a brain-specific PTB counterpart. RNA 3:996-1015. - PMC - PubMed
    1. Baker, B. S. 1989. Sex in flies: the splice of life. Nature 340:521-524. - PubMed
    1. Bell, L. R., J. I. Horabin, P. Schedl, and T. W. Cline. 1991. Positive autoregulation of sex-lethal by alternative splicing maintains the female determined state in Drosophila. Cell 65:229-239. - PubMed
    1. Beyer, A. L., and Y. N. Osheim. 1988. Splice site selection, rate of splicing, and alternative splicing on nascent transcripts. Genes Dev. 2:754-765. - PubMed

Publication types

LinkOut - more resources