. 2003 Aug;23(15):5234-44.
doi: 10.1128/MCB.23.15.5234-5244.2003.

A complex chromatin landscape revealed by patterns of nuclease sensitivity and histone modification within the mouse beta-globin locus

Affiliations

A complex chromatin landscape revealed by patterns of nuclease sensitivity and histone modification within the mouse beta-globin locus

Michael Bulger et al. Mol Cell Biol. 2003 Aug.

Abstract

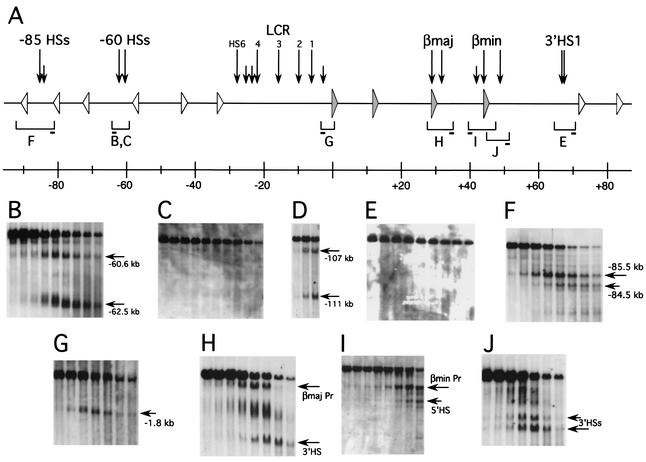
In order to create an extended map of chromatin features within a mammalian multigene locus, we have determined the extent of nuclease sensitivity and the pattern of histone modifications associated with the mouse beta-globin genes in adult erythroid tissue. We show that the nuclease-sensitive domain encompasses the beta-globin genes along with several flanking olfactory receptor genes that are inactive in erythroid cells. We describe enhancer-blocking or boundary elements on either side of the locus that are bound in vivo by the transcription factor CTCF, but we found that they do not coincide with transitions in nuclease sensitivity flanking the locus or with patterns of histone modifications within it. In addition, histone hyperacetylation and dimethylation of histone H3 K4 are not uniform features of the nuclease-sensitive mouse beta-globin domain but rather define distinct subdomains within it. Our results reveal a complex chromatin landscape for the active beta-globin locus and illustrate the complexity of broad structural changes that accompany gene activation.


Figures

FIG. 1.
FIG. 1.
DNase I HSs within and flanking the β-globin locus. (A) Summary of DNase I HSs over the region. The locus is represented to scale, with closed triangles indicating the positions of the β-globin genes and open triangles indicating the positions of the open reading frames of ORGs. HSs are indicated by vertical arrows; shorter arrows are used to mark minor or less intense sites. Brackets beneath the locus correspond to the restriction fragments analyzed in panels B to J, as labeled, with the short bars indicating the positions of the probes used. Numbers on the scale beneath indicate coordinates in kilobases, with bp 1 marking the transcription start site of the Ey-globin gene. (B) Region of kb −60 in SacI digest of nuclei from mouse spleen. Major HSs are marked by horizontal arrows, and their approximate positions on the map in panel A are indicated. (C) Region of kb −60 in SacI digest of nuclei from mouse thymus. (D) Region of kb −111 upstream of human β-globin locus in EcoRI digest of nuclei from MEL cells harboring human chromosome 11. Positions indicated are relative to the human ɛ-globin gene promoter. (E) 3′HS1 region in EcoRV digest of nuclei from mouse thymus. (F) Region of kb −85 in PstI digest of nuclei from mouse spleen. (G) Region upstream of Ey-globin gene promoter in BamHI digest of nuclei from mouse spleen. (H) βmaj-globin gene and downstream region in EcoRI digest of nuclei from mouse spleen. (I) βmin-globin gene and upstream region in EcoRV digest of nuclei from mouse spleen. βmin Pr, βmin gene promoter. (J) βmin-globin gene and downstream region in BamHI digest of nuclei from mouse spleen.
FIG. 2.
FIG. 2.
CTCF binding at sites within and near the β-globin locus. (A) Alignment of selected sequences of known or putative CTCF binding sites. Igf2-H19 m1 and Igf2-H19 h1 are selected sites within the imprinting control regions of the Igf2-H19 loci from the mouse and human loci, respectively (3). DM1 site 1 is a site from the human DM1 locus (17). The remaining sites are derived from β-globin loci in the indicated organisms and are described in the text. Point mutations introduced into the CTCF binding site of mouse 3′HS1 are in boldface and underlined. (B) Results of ChIP assay using antibodies to CTCF. The panel shows products of a representative quantitative duplex PCR with formaldehyde-cross-linked chromatin derived from mouse spleen. I, input DNA; B, antibody-bound fraction; −, control immunoprecipitation with no antibody. Fold enrichments for the test sequence (lower band in each lane) in bound versus input samples are shown at the bottom; this figure combines the results from three separate immunoprecipitations. The control sequence (upper band in each lane) is derived from the mouse pancreatic amylase gene.
FIG. 3.
FIG. 3.
Enhancer-blocking by 3′HS1 but not HS-62.5 shown by colony assays. (A) 3′HS1 colony assay. Test constructs are illustrated to the left. The bar graph shows relative colony numbers obtained for each construct, normalized to the number of colonies obtained with the γβgeo reporter alone (construct 1). HS2 is 5′HS2 from the human β-globin LCR; HS1 is 3′HS1 from the mouse locus; HS1x is the 3′HS1 fragment containing the mutation of the CTCF binding site. (B) HS-62.5 colony assay.
FIG. 4.
FIG. 4.
Generalized nuclease sensitivity at the β-globin locus in erythroid cells. (A) The β-globin locus is represented to scale as in Fig. 1. Underneath this, restriction fragments determined to be relatively sensitive to DNase I are shown as thin lines, and those determined to be relatively insensitive are shown as thick lines. Specific fragments are identified and correspond to those shown in panels B to D. (B) Nuclease digestion profiles for BglII restriction fragments. mTCR is a fragment from the mouse TCRβ-trypsinogen locus. Numbers in parentheses indicate sizes in base pairs of each fragment. The graph at the bottom shows the results of phosphorimager analysis of the Southern blots, with the intensity of the sample band in each lane normalized to that of the first lane. (C) Nuclease digestion profiles and phosphorimager analysis of PstI restriction fragments. (D) Nuclease digestion profiles and phosphorimager analysis of EcoRI restriction fragments.
FIG. 5.
FIG. 5.
Histone modifications across the β-globin and neighboring ORG clusters. Shown in bar graph format are enrichments, relative to control sequences from the amylase and/or necdin genes, of cross-linked chromatin samples immunoprecipitated using antibodies against the indicated products of histone modifications of specific sequences, as determined by quantitative duplex PCR. Values are normalized to test sequence/control sequence ratios for input chromatin samples and for control immunoprecipitations using nonspecific antibody (see Materials and Methods). The data shown are results of a single representative ChIP. The β-globin locus is represented to scale at the top of the figure as in Fig. 1, with the region of nuclease sensitivity indicated by the bracket underneath. The locations of test sequences are shown by the short bars immediately beneath the representation of the β-globin locus and by the bar graphs. In the bar graphs, y-axis values measure relative enrichments (e.g., fivefold and 20-fold). The border between shaded and unshaded regions in each panel represents an enrichment of 1.0-fold, i.e., no measurable enrichment.
FIG. 6.
FIG. 6.
Histone acetylation at the transitions in nuclease sensitivity flanking the β-globin locus. Relative enrichments with acetylated histones H3 (H3Ac) and H4 (H4Ac) are shown in bar graph format as in Fig. 5. The data shown for each probe are averages of results from three to five immunoprecipitations; data for probes assayed in less than three ChIPs are not shown. The values for the two probes for the kb −60 HSs are beyond the limits depicted in the figure. Shaded vertical bars mark the approximate regions of transition in nuclease sensitivity as determined by the data in Fig. 4.

References

    1. Alevy, M. C., M. J. Tsai, and B. W. O'Malley. 1984. DNase I sensitive domain of the gene coding for the glycolytic enzyme glyceraldehyde-3-phosphate dehydrogenase. Biochemistry 23:2309-2314. - PubMed
    1. Anguita, E., C. A. Johnson, W. G. Wood, B. M. Turner, and D. R. Higgs. 2001. Identification of a conserved erythroid specific domain of histone acetylation across the alpha-globin gene cluster. Proc. Natl. Acad. Sci. USA 98:12114-12119. - PMC - PubMed
    1. Bell, A. C., and G. Felsenfeld. 2000. Methylation of a CTCF-dependent boundary controls imprinted expression of the Igf2 gene. Nature 405:482-485. - PubMed
    1. Bell, A. C., A. G. West, and G. Felsenfeld. 1999. The protein CTCF is required for the enhancer blocking activity of vertebrate insulators. Cell 98:387-396. - PubMed
    1. Bender, M. A., M. Bulger, J. Close, and M. Groudine. 2000. Beta-globin gene switching and DNase I sensitivity of the endogenous beta-globin locus in mice do not require the locus control region. Mol. Cell 5:387-393. - PubMed

Publication types

MeSH terms