

Liver microbubble transit time compared with histology and Child-Pugh score in diffuse liver disease: a cross sectional study
- PMID: 12865280
- PMCID: PMC1773750
- DOI: 10.1136/gut.52.8.1188
Liver microbubble transit time compared with histology and Child-Pugh score in diffuse liver disease: a cross sectional study
Abstract
Background: A previous pilot study showed that early arrival time of a microbubble in a hepatic vein is a sensitive indicator of cirrhosis.
Aim: To see if this index can also grade diffuse liver disease.
Patients: Thirty nine fasted patients with histologically characterised disease were studied prospectively. Nine patients had no evidence of liver fibrosis, 10 had fibrosis without cirrhosis, and 20 had cirrhosis (five Child's A, seven Child's B, and eight Child's C).
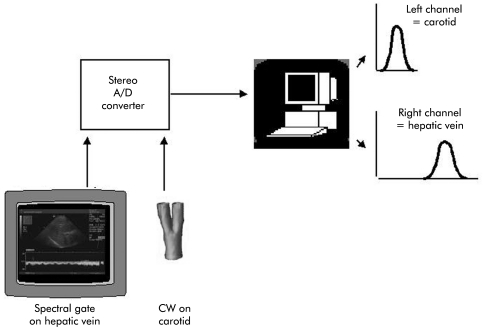
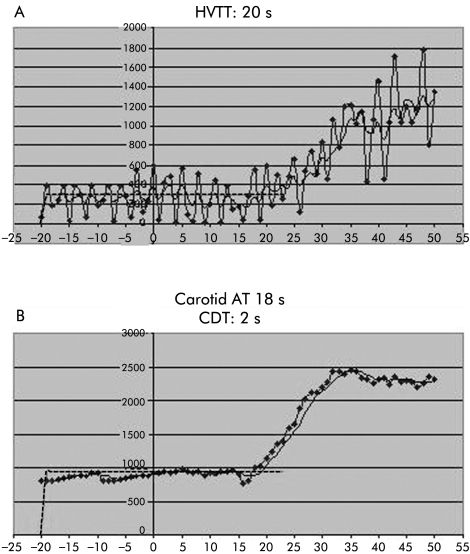
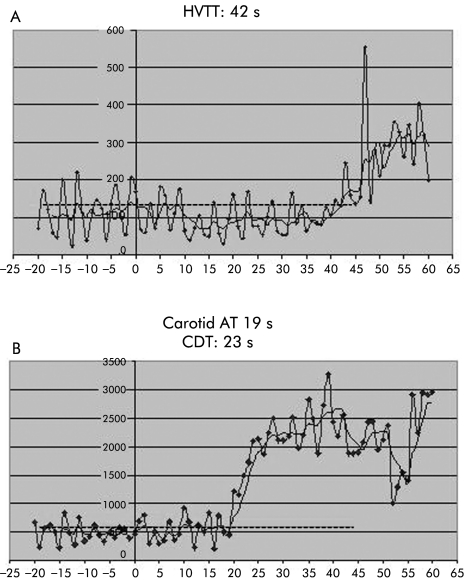
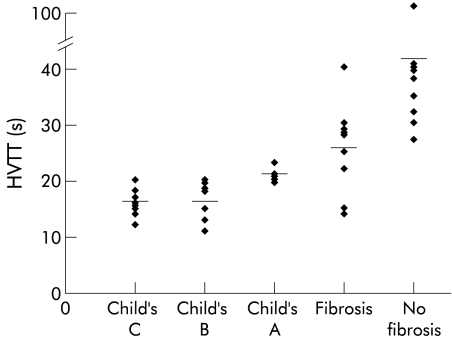
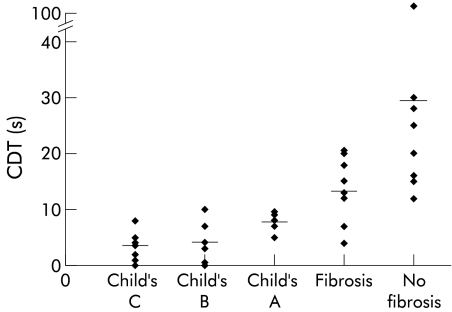
Methods: Bolus injections of a microbubble (Levovist; Schering, Berlin) were given intravenously, followed by a saline flush. Time intensity curves of hepatic vein and carotid artery spectral Doppler signals were analysed. Hepatic vein transit time (HVTT) was calculated as the time after injection at which a sustained signal increase >10% of baseline was seen. Carotid delay time (CDT) was calculated as the difference between carotid and hepatic vein enhancement.
Results: Diagnostic studies were achieved in 38/39 subjects. Both HVTT and CDT became consistently shorter with worsening disease, as follows (means (SD)): HVTT: no fibrosis 44 (25) s, fibrosis 26 (8) s, Child's A 21 (1) s, Child's B 16 (3) s, and Child's C 16 (2) s; CDT: no fibrosis 31 (29) s, fibrosis 14 (6) s, Child's A 8 (1) s, Child's B 4 (4) s, and Child's C 3 (3) s. These differences were highly significant (p<0.001, ANOVA comparison). A HVTT <24 s and a CDT <10 s were 100% sensitive for cirrhosis (20/20 and 18/18, respectively) but not completely specific: 2/8 subjects with fibrosis had CDT values <10 s and 3/9 had HVTT <24 s.
Conclusion: This minimally invasive test shows promise not only in diagnosing cirrhosis but also in assessing disease severity.
Figures
Similar articles
-
Hepatic vein transit times using a microbubble agent can predict disease severity non-invasively in patients with hepatitis C.Gut. 2005 Jan;54(1):128-33. doi: 10.1136/gut.2003.030965. Gut. 2005. PMID: 15591518 Free PMC article.
-
Hepatic vein transit time of SonoVue: a comparative study with Levovist.Radiology. 2006 Jul;240(1):130-5. doi: 10.1148/radiol.2401041517. Epub 2006 May 23. Radiology. 2006. PMID: 16720867
-
Intrahepatic transit time predicts liver fibrosis in patients with chronic hepatitis B: quantitative assessment with contrast-enhanced ultrasonography.Ultrasound Med Biol. 2010 Jul;36(7):1066-75. doi: 10.1016/j.ultrasmedbio.2010.04.012. Ultrasound Med Biol. 2010. PMID: 20620694
-
Hepatic transit time of ultrasound contrast in biopsy characterized liver disease.Acta Radiol. 2005 Oct;46(6):557-60. doi: 10.1080/02841850510021689. Acta Radiol. 2005. PMID: 16334835
-
Non-invasive diagnosis of hepatic cirrhosis by transit-time analysis of an ultrasound contrast agent.Lancet. 1999 May 8;353(9164):1579-83. doi: 10.1016/S0140-6736(98)06373-9. Lancet. 1999. PMID: 10334257
Cited by
-
Hepatic vein transit times using a microbubble agent can predict disease severity non-invasively in patients with hepatitis C.Gut. 2005 Jan;54(1):128-33. doi: 10.1136/gut.2003.030965. Gut. 2005. PMID: 15591518 Free PMC article.
-
Diagnosis of liver cirrhosis by transit-time analysis at contrast-enhanced ultrasonography.Radiol Med. 2008 Sep;113(6):860-74. doi: 10.1007/s11547-008-0292-3. Epub 2008 Jun 27. Radiol Med. 2008. PMID: 18587531 English, Italian.
-
Contrast-enhanced ultrasonography for the evaluation of liver fibrosis after biliary obstruction.World J Gastroenterol. 2015 Mar 7;21(9):2614-21. doi: 10.3748/wjg.v21.i9.2614. World J Gastroenterol. 2015. PMID: 25759528 Free PMC article.
-
Noninvasive mapping of the redox status of dimethylnitrosamine-induced hepatic fibrosis using in vivo dynamic nuclear polarization-magnetic resonance imaging.Sci Rep. 2016 Sep 2;6:32604. doi: 10.1038/srep32604. Sci Rep. 2016. PMID: 27587186 Free PMC article.
-
Assessment of tissue perfusion by contrast-enhanced ultrasound.Eur Radiol. 2011 Mar;21(3):604-15. doi: 10.1007/s00330-010-1965-6. Epub 2010 Oct 7. Eur Radiol. 2011. PMID: 20927527
References
-
- Gosink BB, Lemon SK, Scheible W, et al. Accuracy of ultrasonography in diagnosis of hepatocellular disease. AJR Am J Roentgenol 1979;133:19–23. - PubMed
-
- Sandford NL, Walsh P, Matis C, et al. Is ultrasonography useful in the assessment of diffuse parenchymal liver disease? Gastroenterology 1985;89:186–91. - PubMed
-
- Rofsky NM, Fleishaker H. CT and MRI of diffuse liver disease. Semin Ultrasound CT MR 1995;16:16–33. - PubMed
-
- Mergo PJ, Ros PR, Buetow PC, et al. Diffuse disease of the Liver: radiologic- pathologic correlation. Radiographics 1994;14:1291–307. - PubMed
-
- Cosgrove DO, Blomley MJK, et al. Ultrasound of the liver and biliary tract. In: Blumgart L, Fong Y, eds. Surgery of the Liver and Biliary Tract, 3rd edn. London: WB Saunders (Harcourt Publishers), 2000:227–69.
Publication types
MeSH terms
Substances
LinkOut - more resources
Full Text Sources
Medical