

Profiling of Hodgkin's lymphoma cell line L1236 and germinal center B cells: identification of Hodgkin's lymphoma-specific genes
- PMID: 12865944
- PMCID: PMC1430727
Profiling of Hodgkin's lymphoma cell line L1236 and germinal center B cells: identification of Hodgkin's lymphoma-specific genes
Erratum in
- Mol Med. 2003 Sep-Dec;9(9-12):235
Abstract
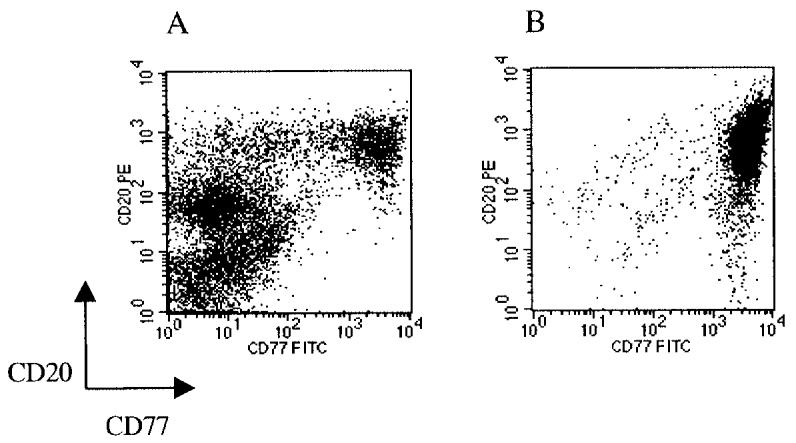
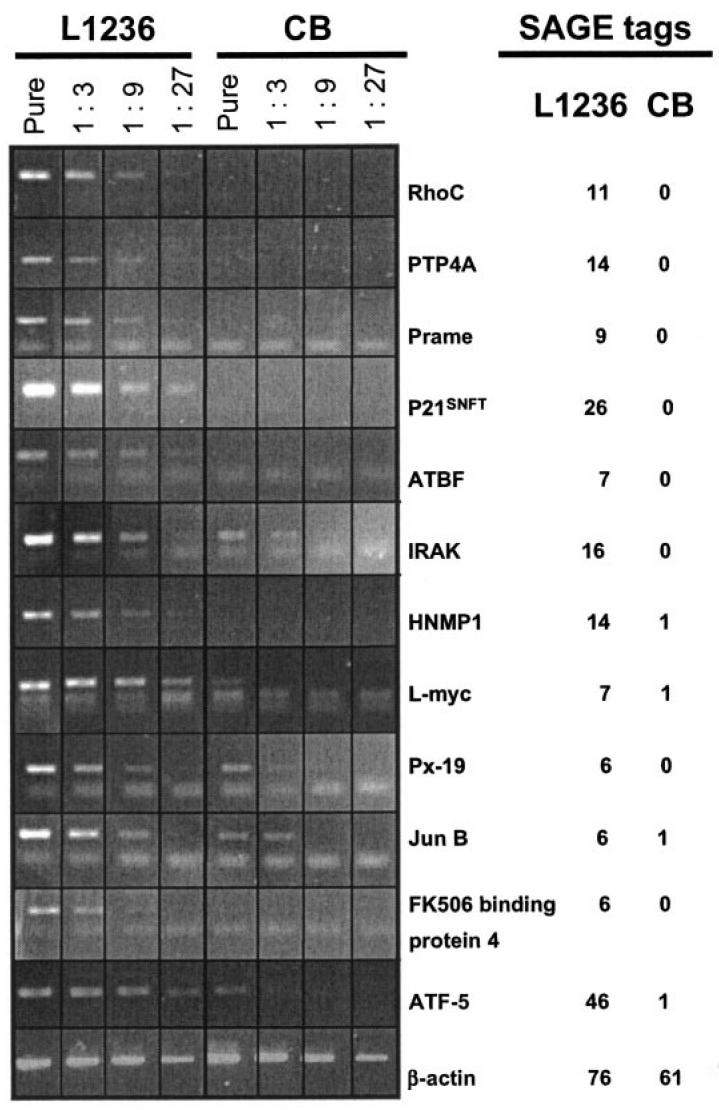
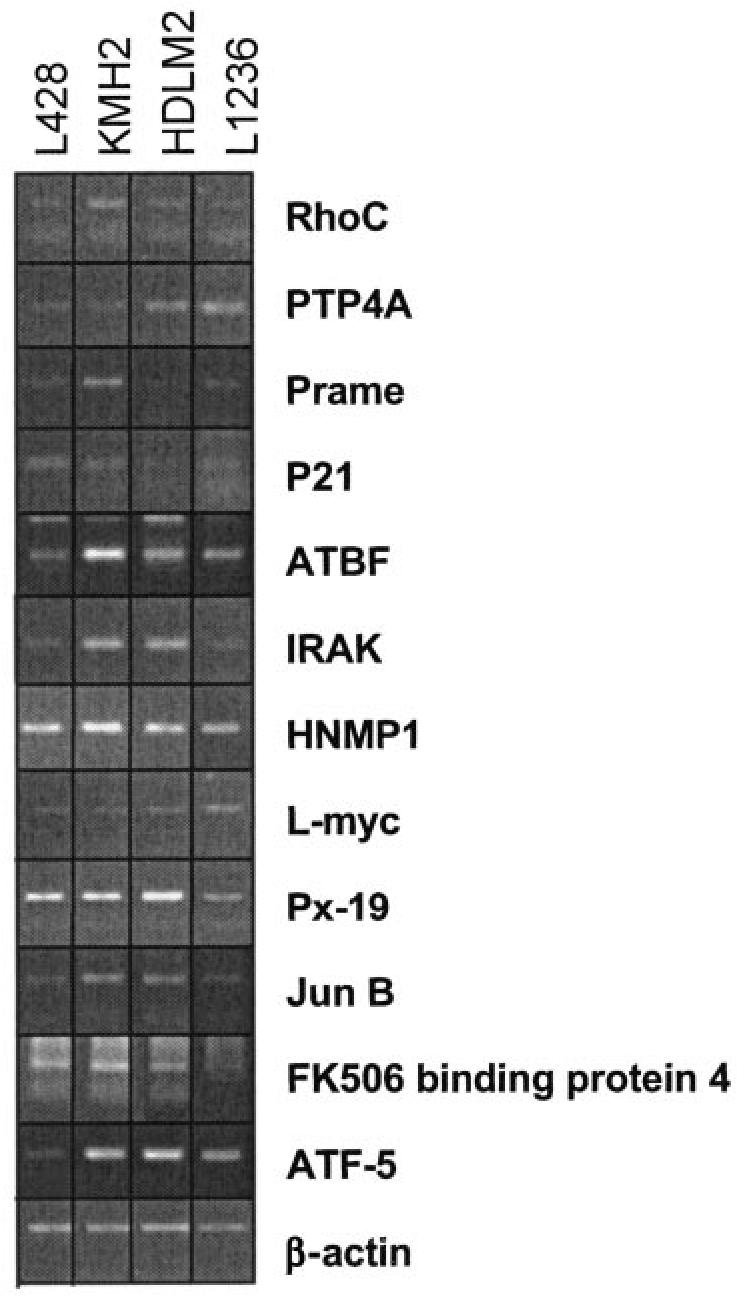
The malignant cells of classical Hodgkin's lymphoma (cHL), Hodgkin and Reed-Sternberg (HRS) cells, appear to be derived from germinal center (GC) B cells in most cases of the disease. Apart from recent findings of constitutive activation of some transcription factors and autocrine stimulation by cytokine receptors, the mechanisms of malignant transformation in cHL still remain poorly understood. We performed a large scale gene expression study using serial analysis of gene expression (SAGE), comparing the cHL cell line L1236 and human GC B cells. Semiquantitative RT-PCR was used to confirm results from the SAGE and to analyze gene expression in 3 additional cHL cell lines. To investigate expression of some genes in cHL cases, we applied RT-PCR on microdissected HRS cells. In total, 464 genes showed a change in expression level of 5-fold or higher. For 12 genes (out of 177) identified as upregulated in L1236 cells, RT-PCR confirmed the SAGE results and also showed elevated expression in 3 other cHL cell lines. For 3 of the upregulated genes, expression by HRS cells in the tissue also was confirmed. Several of the differentially expressed genes may play a role in the pathogenesis of cHL because they represent potential oncogenes, such as rhoC, L-myc, and PTP4A, or transcription factors, such as ATF-5, ATBF1, and p21SNFT. The genes that showed significantly deregulated expression in HRS cells should be helpful not only for the identification of genes involved in the pathogenesis of cHL but also for discovering potential prognostic markers or therapeutic targets.
Figures
Similar articles
-
The early transcription factor GATA-2 is expressed in classical Hodgkin's lymphoma.J Pathol. 2004 Dec;204(5):538-45. doi: 10.1002/path.1664. J Pathol. 2004. PMID: 15538755
-
Detection of genomic imbalances in microdissected Hodgkin and Reed-Sternberg cells of classical Hodgkin's lymphoma by array-based comparative genomic hybridization.Haematologica. 2008 Sep;93(9):1318-26. doi: 10.3324/haematol.12875. Epub 2008 Jul 18. Haematologica. 2008. PMID: 18641027
-
Analyzing primary Hodgkin and Reed-Sternberg cells to capture the molecular and cellular pathogenesis of classical Hodgkin lymphoma.Blood. 2012 Nov 29;120(23):4609-20. doi: 10.1182/blood-2012-05-428896. Epub 2012 Sep 5. Blood. 2012. PMID: 22955914
-
Molecular biology of Hodgkin's and Reed/Sternberg cells in Hodgkin's lymphoma.Int J Cancer. 2006 Apr 15;118(8):1853-61. doi: 10.1002/ijc.21716. Int J Cancer. 2006. PMID: 16385563 Review.
-
Evidence of abortive plasma cell differentiation in Hodgkin and Reed-Sternberg cells of classical Hodgkin lymphoma.Hematol Oncol. 2005 Sep-Dec;23(3-4):127-32. doi: 10.1002/hon.764. Hematol Oncol. 2005. PMID: 16342298 Review.
Cited by
-
Phosphatase of regenerating liver-3 (PRL-3) is overexpressed in classical Hodgkin lymphoma and promotes survival and migration.Exp Hematol Oncol. 2018 Apr 10;7:8. doi: 10.1186/s40164-018-0100-2. eCollection 2018. Exp Hematol Oncol. 2018. PMID: 29651360 Free PMC article.
-
The role and target potential of protein tyrosine phosphatases in cancer.Curr Oncol Rep. 2008 Mar;10(2):114-21. doi: 10.1007/s11912-008-0019-6. Curr Oncol Rep. 2008. PMID: 18377824 Review.
-
Safety and Efficacy in Relapsed or Refractory Classic Hodgkin's Lymphoma Treated with PD-1 Inhibitors: A Meta-Analysis of 9 Prospective Clinical Trials.Biomed Res Int. 2019 Dec 17;2019:9283860. doi: 10.1155/2019/9283860. eCollection 2019. Biomed Res Int. 2019. PMID: 31950058 Free PMC article. Review.
-
Development of a New Highly Selective Monoclonal Antibody against Preferentially Expressed Antigen in Melanoma (PRAME) and Identification of the Target Epitope by Bio-Layer Interferometry.Int J Mol Sci. 2021 Mar 20;22(6):3166. doi: 10.3390/ijms22063166. Int J Mol Sci. 2021. PMID: 33804612 Free PMC article.
-
Usefulness of BATF3 Immunohistochemistry in Diagnosing Classical Hodgkin Lymphoma.Diagnostics (Basel). 2021 Jun 20;11(6):1123. doi: 10.3390/diagnostics11061123. Diagnostics (Basel). 2021. PMID: 34202976 Free PMC article.
References
-
- Drexler HG. Recent results on the biology of Hodgkin and Reed-Sternberg cells. I biopsy material. Leuk Lymphoma. 1992;8:283–313. - PubMed
-
- Küppers R. Molecular biology of Hodgkin’s lymphoma. Adv Cancer Res. 2002;84:277–312. - PubMed
-
- Stein H, et al. Down-regulation of BOB. 1/OBF1 and Oct2 in classical Hodgkin disease but not in lymphocyte predominant Hodgkin disease correlates with immunoglobulin transcription. Blood. 2001;97:496–501. - PubMed
Publication types
MeSH terms
Substances
LinkOut - more resources
Full Text Sources
Other Literature Sources
Medical
Research Materials
Miscellaneous