. 2003 Sep 26;278(39):38084-93.
doi: 10.1074/jbc.M307028200. Epub 2003 Jul 16.

De-orphanization of cytochrome P450 2R1: a microsomal vitamin D 25-hydroxilase

Affiliations

De-orphanization of cytochrome P450 2R1: a microsomal vitamin D 25-hydroxilase

Jeffrey B Cheng et al. J Biol Chem. .

Abstract

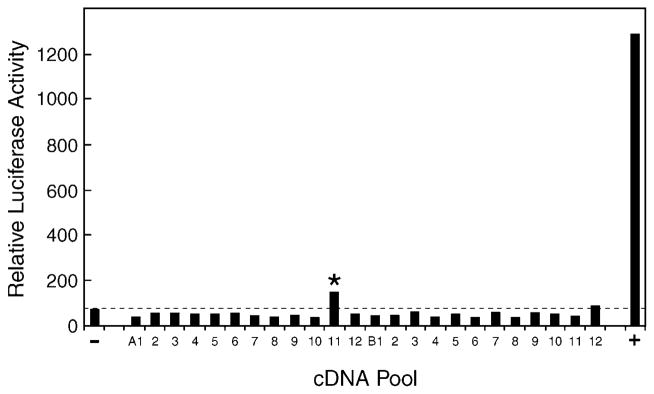
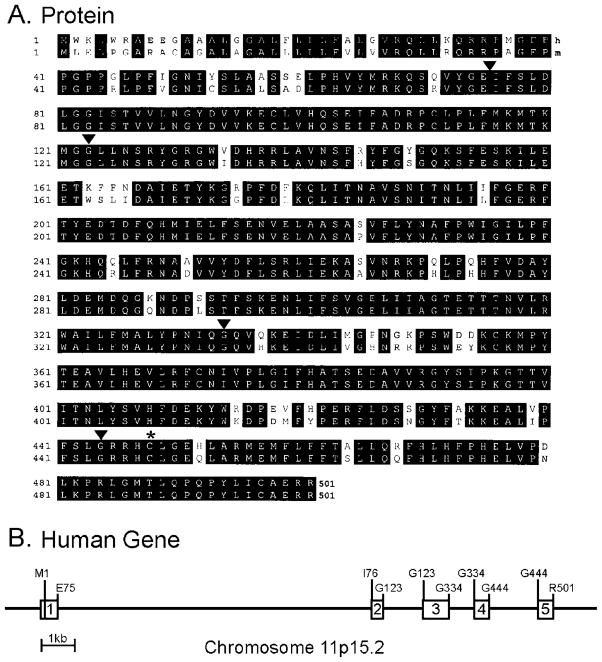
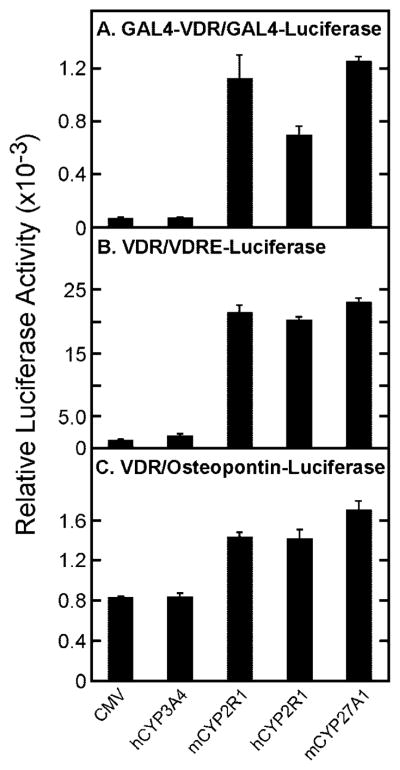
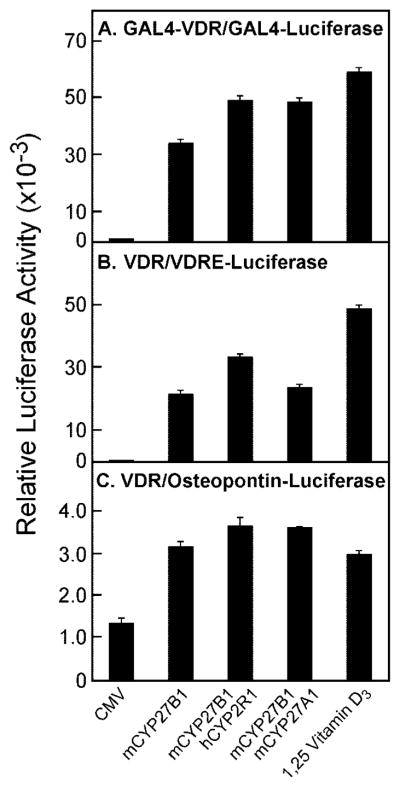
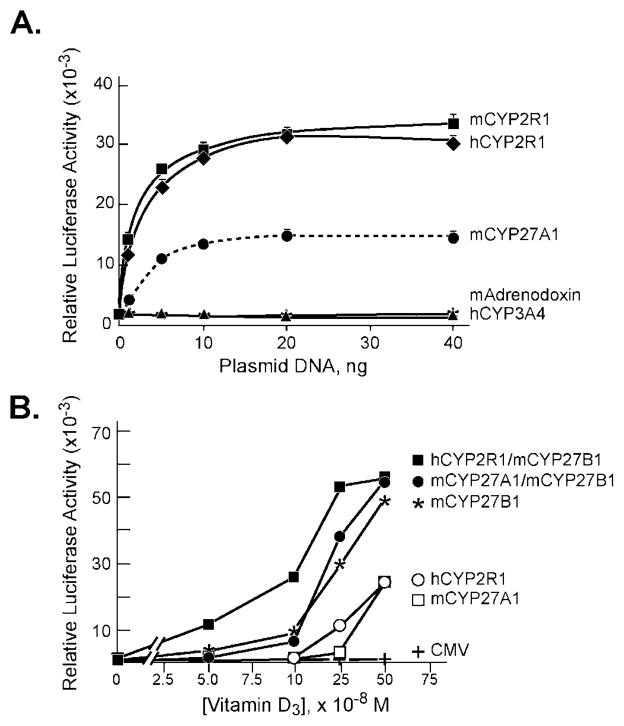
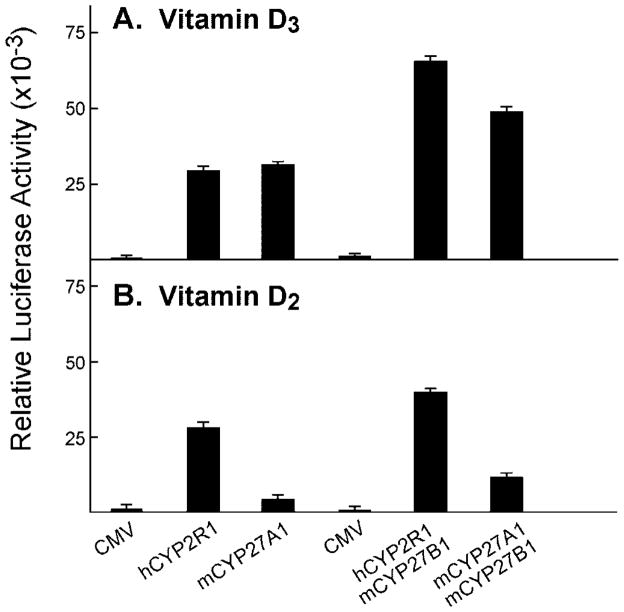
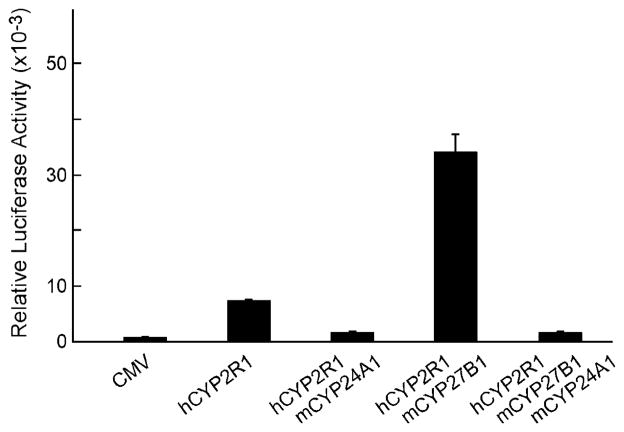
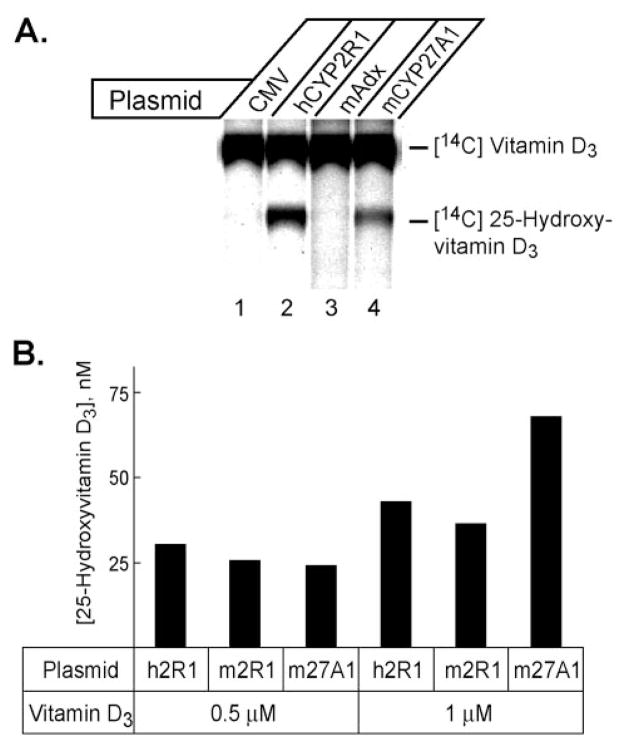
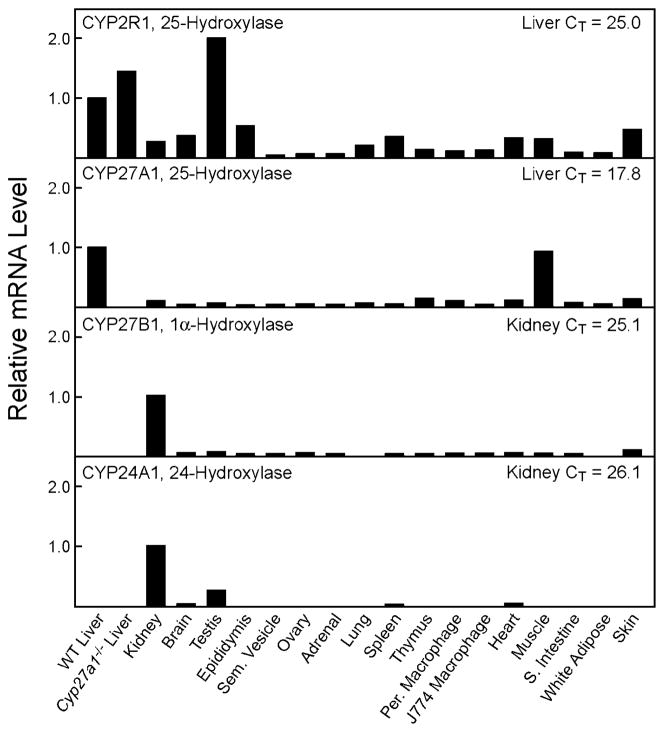
The conversion of vitamin D into an active ligand for the vitamin D receptor requires 25-hydroxylation in the liver and 1alpha-hydroxylation in the kidney. Mitochondrial and microsomal vitamin D 25-hydroxylase enzymes catalyze the first reaction. The mitochondrial activity is associated with sterol 27-hydroxylase, a cytochrome P450 (CYP27A1); however, the identity of the microsomal enzyme has remained elusive. A cDNA library prepared from hepatic mRNA of sterol 27-hydroxylase-deficient mice was screened with a ligand activation assay to identify an evolutionarily conserved microsomal cytochrome P450 (CYP2R1) with vitamin D 25-hydroxylase activity. Expression of CYP2R1 in cells led to the transcriptional activation of the vitamin D receptor when either vitamin D2 or D3 was added to the medium. Thin layer chromatography and radioimmunoassays indicated that the secosteroid product of CYP2R1 was 25-hydroxyvitamin D3. Co-expression of CYP2R1 with vitamin D 1alpha-hydroxylase (CYP27B1) elicited additive activation of vitamin D3, whereas co-expression with vitamin D 24-hydroxylase (CYP24A1) caused inactivation. CYP2R1 mRNA is abundant in the liver and testis, and present at lower levels in other tissues. The data suggest that CYP2R1 is a strong candidate for the microsomal vitamin D 25-hydroxylase.


Figures

Fig. 1
Fig. 1. Expression cloning of vitamin D 25-hydroxylase cDNA
A cDNA library was constructed from hepatic mRNA purified from sterol 27-hydroxylase-deficient mice and divided into pools of ~100 cDNAs each. Plasmid DNA (75 ng) from individual pools was combined with 20 ng of a GAL4-vitamin D receptor expression plasmid, 20 ng of a GAL4-responsive luciferase reporter gene plasmid, 20 ng of a CMV-β-galactosidase plasmid (for normalization purposes), 5 ng of a mouse adrenodoxin expression plasmid (to boost the activity of mitochondrial P450s encoded by the cDNA pools), and 10 ng of the VA1 plasmid (to increase expression from the receptor and reporter gene plasmids; Ref. 30), and introduced via the FuGENE 6 reagent (Roche) into HEK 293 cells cultured in microtiter plates. 1α-Hydroxyvitamin D3 (10 nM) was added to the medium 8–10 h later. After an additional incubation of 16–20 h in an atmosphere of 91.2% air and 8.8% CO2, the cells were disrupted in the microtiter plate by the addition of 100 μl of Lysis Buffer, and aliquots of 20 and 40 μl were assayed by luminometry and spectroscopy, respectively, for luciferase and β-galactosidase enzyme activity. Relative luciferase activity was calculated for each well by dividing luciferase enzyme activity by the amount of β-galactosidase activity per unit of time. One pool of cDNAs (A11, marked by asterisk) produced a modest activation of the vitamin D receptor-reporter system compared with that obtained with the pCMV vector alone (−) and a positive control (+) consisting of a plasmid encoding the mouse CYP27A1 vitamin D 25-hydroxylase.
Fig. 2
Fig. 2. Amino acid sequences and gene structure of cytochrome P450 2R1
A, the deduced sequences of the human (h) and mouse (m) CYP2R1 proteins are aligned with identities between the two enzymes indicated by black boxes. Amino acids are numbered on the left. Arrowheads above the alignment indicate the positions of introns in the encoding genes. An asterisk indicates the cysteine residue that is predicted to ligand with the heme cofactor. The GenBank/EBI Data Bank accession numbers for the human and mouse CYP2R1 cDNA sequences are AY323817 and AY323818, respectively. B, structure of the human CYP2R1 gene. Exons are indicated by boxes and introns by connecting lines. Amino acids encoded at the beginning and end of the protein are indicated above the gene schematic together with those at exon-intron junctions. The structure of the gene and its indicated chromosomal location were deduced by comparing the sequences of the cloned cDNA to those of the genomic DNA (GenBank/EBI Data Bank accession no. NT_009237.15).
Fig. 3
Fig. 3. Activation of vitamin D3 by CYP2R1
The indicated vitamin D receptor-reporter systems were introduced into HEK 293 cells grown in 60-mm dishes together with the expression plasmids designated at the bottom of the figure. Relative luciferase enzyme activity was determined 16–20 h later as indicated under “Experimental Procedures,” and the means ± S.E. for experiments carried out in triplicate were plotted as histograms. The amounts of vitamin D3 added to the medium were 0.5 μM (A and B) and 1 μM (C).
Fig. 4
Fig. 4. Activation of vitamin D3 by cytochrome P450 enzymes
Plasmids encoding the indicated vitamin D receptor-reporter systems were transfected into HEK 293 cells grown in 60-mm dishes together with DNAs encoding the hydroxylase enzymes shown at the bottom of the figure. Relative luciferase enzyme activity was measured 16–20 h later, and the means ± S.E. of values derived from experiments performed in triplicate were calculated. The amounts of vitamin D3 added to the culture medium were 0.5 μM (A), 0.25 μM (B), and 5 μM (C). 1α,25-dihydroxyvitamin D3 (0.01 μM) was added in the absence of hydroxylase expression plasmids to control wells for the receptor-reporter systems to generate the data shown by the histogram bars on the right of each panel.
Fig. 5
Fig. 5. Response of VDR/VDRE-luciferase reporter system to P450 expression vectors and vitamin D3
A, the indicated amounts of P450 expression plasmids were introduced by transfection with the FuGENE6 reagent into HEK 293 cells grown in 60-mm dishes. Relative luciferase enzyme activities were measured 16–20 h later, and means ± S.E. were calculated from individual experiments performed in triplicate. The concentration of 1α-hydroxyvitamin D3 added to the culture medium was 1 nM. B, P450 expression vectors (5–20 ng of plasmid DNA) were transfected into HEK 293 cells grown in 60-mm dishes in medium containing the indicated concentrations of vitamin D3. Relative luciferase enzyme activities were determined 16–20 h later. Mean values based on data from triplicate dishes for each concentration of vitamin D3 were plotted.
Fig. 6
Fig. 6. Activation of vitamin D3 and vitamin D2 by microsomal versus mitochondrial P450 enzymes
Vectors specifying the VDR/VDRE-luciferase reporter system were introduced into HEK 293 cells grown in 60-mm dishes together with the indicated expression plasmids encoding no protein (CMV) or various vitamin D hydroxylases. Relative luciferase enzyme activities were measured 16–20 h later. The means ± S.E. were calculated for each plasmid or combination of plasmids analyzed in triplicate. A, the concentration of vitamin D3 in the medium of dishes transfected with the CMV, hCYP2R1, and mCYP27A1 plasmids (left three histogram bars) was 0.5 μM, and the concentration in the medium of dishes transfected with CMV, hCYP2R1 + mCYP27B1, and mCYP27A1 + mCYP27B1 plasmids (right three histogram bars) was 0.25 μM. B, the concentration of vitamin D2 in the medium of dishes transfected with the CMV, hCYP2R1, and mCYP27A1 plasmids (left three histogram bars) was 0.5 μM, and that in the medium of dishes transfected with CMV, hCYP2R1 + mCYP27B1, and mCYP27A1 + mCYP27B1 plasmids (right three histogram bars) was 0.1 μM.
Fig. 7
Fig. 7. Inactivation of vitamin D metabolites by expression of CYP24A1 vitamin D 24-hydroxylase
The indicated plasmid or combinations of plasmid DNAs were introduced into HEK 293 cells cultured in 60-mm dishes together with vectors specifying the VDR/VDRE-luciferase reporter system. Vitamin D3 was added to the medium at a final concentration of 0.25 μM, and relative luciferase activity was measured in triplicate dishes 16–20 h later as described under “Experimental Procedures.” Means ± S.E. were calculated and plotted as histograms. Co-expression of the CYP24A1 vitamin D 24-hydroxylase with either the CYP2R1 25-hydroxylase, or a combination of CYP2R1 and the CYP27B1 1α-hydroxylase, led to a reduction of vitamin D receptor activation and lower luciferase enzyme activity.
Fig. 8
Fig. 8. Biochemical and immunological identification of CYP2R1 vitamin D metabolites
A, the indicated expression plasmids were introduced into HEK 293 cells cultured in 60-mm dishes. 18 h later, 14C-labeled vitamin D3 was added to the medium, and the incubation continued for an additional 96 h. Vitamin D metabolites were extracted from the medium into 8 ml of chloroform:methanol (2:1), dried under a stream of N2, resuspended in 50 μl of acetone, and separated by thin layer chromatography on silica plates. The plates were dried and subjected to phosphorimage analysis to reveal the locations of radioactivity. The identities of the radiolabeled compounds were determined based on their co-migration with authentic vitamin D3 and 25-hydroxyvitamin D3 standards chromatographed in adjacent lanes on the plate. The mAdx plasmid expresses mouse adrenodoxin. B, radioimmunoassay of vitamin D metabolites produced in transfected cells. The indicated plasmid expression vectors were introduced by transfection into HEK 293 cells grown in 96-well microtiter plates. 10 h later, 0.5 or 1 μM vitamin D3 was added to the medium and the incubation continued for an additional 44 h. Thereafter, the medium from replicate wells was pooled and subjected to radioimmunoassay using a kit containing antibodies directed against 25-hydroxyvitamin D3. The values obtained were compared with those of a standard curve to estimate the amount of 25-hydroxyvitamin D produced in duplicate dishes. A background value corresponding to the amount of 25-hydroxyvitamin D detected in the medium from cells transfected with the CMV vector plasmid (17.2 nM) was subtracted from the experimental values and the resulting number plotted as a histogram.
Fig. 9
Fig. 9. Tissue distributions of mouse vitamin D hydroxylase mRNAs
The relative levels of the vitamin D hydroxylase mRNAs were determined by real-time PCR in the tissues and cell types indicated at the bottom of the figure using cyclophilin mRNA levels as a reference standard. The data for a given hydroxylase mRNA were normalized to the threshold (CT) values determined in the liver for the CYP2R1 and CYP27A1 mRNAs (top two panels), and to the kidney CT values for the CYP27B1 and CYP24A1 mRNAs (bottom two panels). WT liver, wild type liver; Cyp27a1−/− Liver, liver of CYP27A1 sterol 27-hydroxylase-deficient mice; Sem. Vesicle, seminal vesicle; Per. Macrophage, peritoneal macrophages elicited by a thioglycolate challenge (43); J774 Macrophage, transformed mouse macrophage cells (ATCC no. TIB-67); S. Intestine, small intestine.

References

    1. Simoni RD, Hill RL, Vaughan M. J Biol Chem. 2002;277:9623. - PubMed
    1. Ponchon G, DeLuca HF. J Clin Invest. 1969;48:1273–1279. - PMC - PubMed
    1. Ponchon G, Kennan AL, DeLuca HF. J Clin Invest. 1969;48:2032–2037. - PMC - PubMed
    1. Blunt JW, DeLuca HF, Schnoes HK. Biochemistry. 1968;7:3317–3322. - PubMed
    1. Haussler MR, Myrtle JF, Norman AW. J Biol Chem. 1968;243:4055–4064. - PubMed

Publication types

Associated data