

The phosphate starvation stimulon of Corynebacterium glutamicum determined by DNA microarray analyses
- PMID: 12867461
- PMCID: PMC165763
- DOI: 10.1128/JB.185.15.4519-4529.2003
The phosphate starvation stimulon of Corynebacterium glutamicum determined by DNA microarray analyses
Abstract
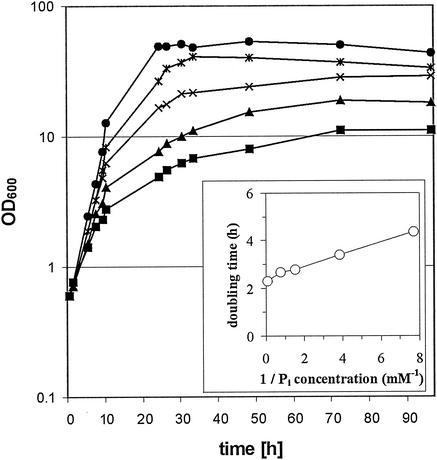
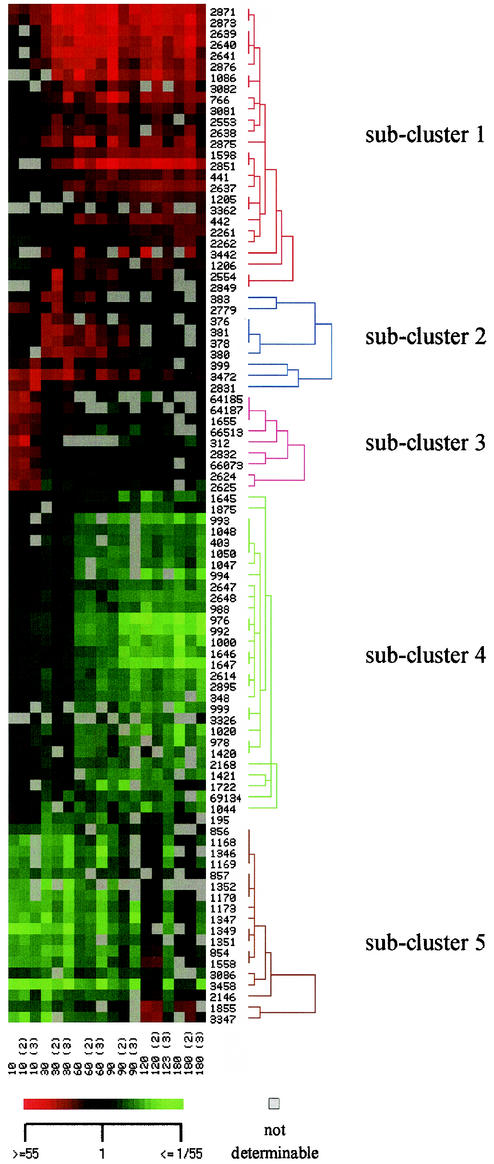
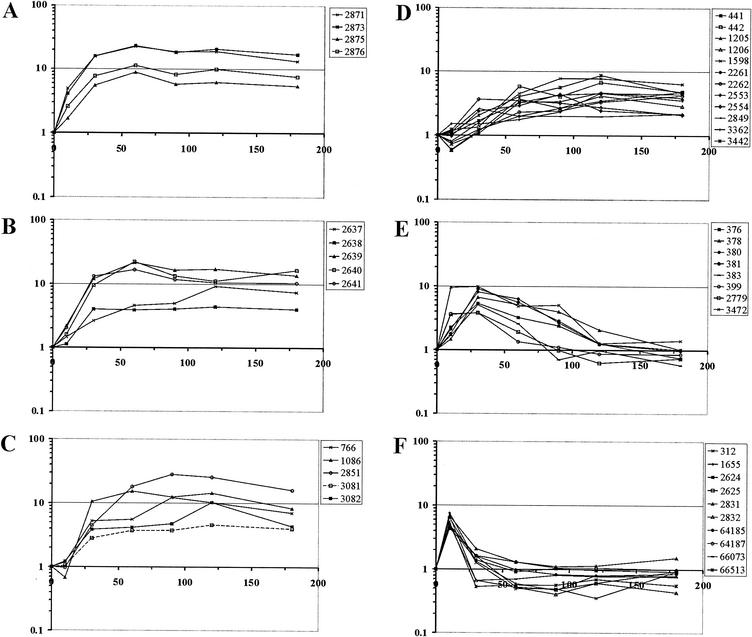
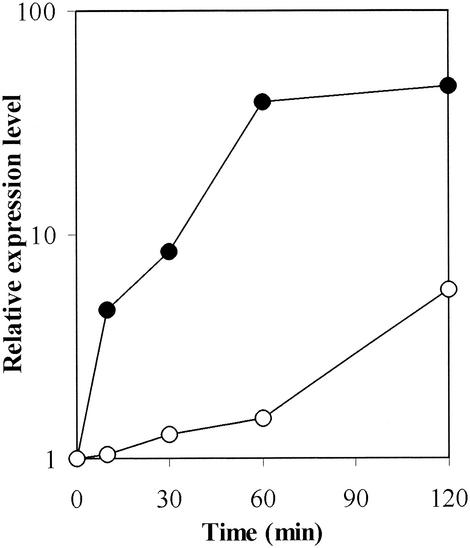
The phosphate (P(i)) starvation stimulon of Corynebacterium glutamicum was characterized by global gene expression analysis by using DNA microarrays. Hierarchical cluster analysis of the genes showing altered expression 10 to 180 min after a shift from P(i)-sufficient to P(i)-limiting conditions led to identification of five groups comprising 92 genes. Four of these groups included genes which are not directly involved in P metabolism and changed expression presumably due to the reduced growth rate observed after the shift or to the exchange of medium. One group, however, comprised 25 genes, most of which are obviously related to phosphorus (P) uptake and metabolism and exhibited 4- to >30-fold-greater expression after the shift to P(i) limitation. Among these genes, the RNA levels of the pstSCAB (ABC-type P(i) uptake system), glpQ (glycerophosphoryldiester phosphodiesterase), ugpAEBC (ABC-type sn-glycerol 3-phosphate uptake system), phoH (unknown function), nucH (extracellular nuclease), and Cgl0328 (5'-nucleotidase or related esterase) genes were increased, and pstSCAB exhibited a faster response than the other genes. Transcriptional fusion analyses revealed that elevated expression of pstSCAB and ugpAEBC was primarily due to transcriptional regulation. Several genes also involved in P uptake and metabolism were not affected by P(i) starvation; these included the genes encoding a PitA-like P(i) uptake system and a putative Na(+)-dependent P(i) transporter and the genes involved in the metabolism of pyrophosphate and polyphosphate. In summary, a global, time-resolved picture of the response of C. glutamicum to P(i) starvation was obtained.
Figures
References
-
- Aguena, M., E. Yagil, and B. Spira. 2002. Transcriptional analysis of the pst operon of Escherichia coli. Mol. Genet. Genomics 268:518-524. - PubMed
-
- Akiyama, M., E. Crooke, and A. Kornberg. 1993. An exopolyphosphatase of Escherichia coli. The enzyme and its ppx gene in a polyphosphate operon. J. Biol. Chem. 268:633-639. - PubMed
-
- Andersen, A. B., L. Ljungqvist, and M. Olsen. 1990. Evidence that protein antigen b of Mycobacterium tuberculosis is involved in phosphate metabolism. J. Gen Microbiol. 136:477-480. - PubMed
-
- Arfin, S. M., A. D. Long, E. T. Ito, L. Tolleri, M. M. Riehle, E. S. Paegle, and G. W. Hatfield. 2000. Global gene expression profiling in Escherichia coli K12. The effects of integration host factor. J. Biol. Chem. 275:29672-29684. - PubMed
Publication types
MeSH terms
Substances
LinkOut - more resources
Full Text Sources
Other Literature Sources
Molecular Biology Databases
Research Materials
Miscellaneous
