. 2003 Jul 16;23(15):6373-84.
doi: 10.1523/JNEUROSCI.23-15-06373.2003.

Calcium dependence of retrograde inhibition by endocannabinoids at synapses onto Purkinje cells

Affiliations

Calcium dependence of retrograde inhibition by endocannabinoids at synapses onto Purkinje cells

Stephan D Brenowitz et al. J Neurosci. .

Abstract

Many types of neurons release endocannabinoids from their dendrites in response to elevation of intracellular calcium levels. Endocannabinoids then activate presynaptic cannabinoid receptors, thereby inhibiting neurotransmitter release for tens of seconds. A crucial step in understanding the physiological role of this retrograde signaling is to determine its sensitivity to elevations of postsynaptic calcium. Here we determine and compare the calcium dependence of endocannabinoid-mediated retrograde inhibition at three types of synapses onto cerebellar Purkinje cells. Previous studies have shown that Purkinje cell depolarization results in endocannabinoid-mediated retrograde inhibition of synapses received from climbing fibers, granule cell parallel fibers, and inhibitory interneurons. Using several calcium indicators with a range of affinities, we performed a series of in situ and in vitro calibrations to quantify calcium levels in Purkinje cells. We found that postsynaptic calcium levels of approximately 15 microM are required for half-maximal retrograde inhibition at all of these synapses. In contrast, previous studies had suggested that endocannabinoid release could occur with slight elevations of calcium above resting levels, which implies that inhibition should be widespread and continuously modulated by subtle changes in intracellular calcium levels. However, our results indicate that such small changes in intracellular calcium are not sufficient to evoke endocannabinoid release. Instead, because of its high requirement for calcium, retrograde inhibition mediated by calcium-dependent endocannabinoid release from Purkinje cells will occur under more restricted conditions and with greater spatial localization than previously appreciated.


Figures
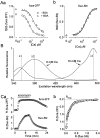
Figure 1.
Figure 1.
Calibration of calcium indicators. A, Calcium dependence of fura-2FF (Aa) and fluo-5N(Ab)fluorescence in the CsMeSO4 calibration buffer in the absence (circles) and presence (triangles) of BSA (20 mg/ml). BSA increased the KD offura-2FF from 8 to 32 μm but did not alter the KD of fluo-5N. B, Fluorescence excitation spectra for a combination of fura-2FF (500 μm) and fluo-5N (250 μm) measured in a cuvette, measured at 0 mm Ca (6 mm EGTA) and 10 mm Ca. This dye combination has an isosbestic point of 355 nm (λ1). Fura-2FF and fluo-5N have peaks at 380 nm (λ2) and 490 nm (λ3), respectively. C, In situ measurement of Rmax with ionomycin. Ca, Fluorescence ratios for fura-2FF and fluo-5N were monitored at 15 sec intervals during bath application of ionomycin (20 μm) in the presence of 10 mm Ca. After 10 min of ionomycin application, 4 mm EGTA with no added calcium or ionomycin was bath applied. Cb, Ratio changes in fura-2FF plotted against ratio changes in fluo-5N. Saturation of fura-2FF was apparent during ionomycin application.
Figure 2.
Figure 2.
Graded calcium transients in cerebellar Purkinje cells. A, Purkinje cell from a P10 rat in a sagittal slice. The cell was loaded with fura-2FF and excited at 380 nm. B, Top, Voltage steps from -60 to 0 mV were delivered for a duration of 100–1000 msec, followed by a 200 msec ramp from -90 to -60 mV. Bottom, Calcium currents recorded in the presence of intracellular Cs, TEA, and QX-314. C, Graded fluorescence transients were produced by voltage steps from B, delivered at the time indicated by the arrow, with the largest transients corresponding to the longest depolarizations. A region selected from the image in A (right) was used for analysis. Exposures were obtained at 250 msec intervals.
Figure 3.
Figure 3.
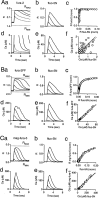
Quantification of dendritic calcium transients. Purkinje cells were loaded with different indicator pairs, fura-2/fluo-5N (A), fura-2FF/fluo-5N (B), and mag-fura-5/fluo-5N (C). Fluorescence transients produced by a series of voltage steps were then measured simultaneously for each pair of indicators. Fluorescence ratios are plotted for fura-2, fura-2FF, or mag-fura-5 in a, and Rmin and Rmax are indicated in with dotted line. Fluorescence ratios for fluo-5N are plotted in b. Ratios determined with indicator pairs are compared in c, where ratios were normalized so that Rmin = 0 and Rmax = 1. Ind and e, calciumvalues were then calculated from the traces in a and b, respectively, using the using calibration parameters described in Materials and Methods. In f the values of calcium determined for each of a pair of indicators are plotted for the purpose of comparison. A line with a slope of 1 is indicated with dotted lines, and regressions of the data points are indicated with solid lines with slopes of 1.06 for Af, 1.02 for Bf, and 1.04 for Cf. In A and B, voltage steps (50, 100, 250, 500, 1000 msec) were delivered, and in C, the 50 msec voltage step was omitted. In Aa, Ab, Ad, and Ae, gray traces correspond to 50 and 100 msec depolarizations. In Ae and Af, calcium concentrations calculated from fura-2 fluorescence ratios that exceeded 2 μm were not displayed. Points corresponding to calculated values of Capost >77 μm (10 times the KD of fura-2FF) or 380 μm (10 times the KD of mag-fura-5) were not displayed in Bf and Cf, respectively.
Figure 4.
Figure 4.
Calcium dependence of DSE at the parallel fiber to Purkinje cell synapse. A, DSE of parallel fiber EPSCs was measured after voltage steps of 100–1000 msec delivered to a Purkinje cell loaded with fura-2FF. Voltage steps (top) and resulting calcium transients (bottom) are imaged in the dendritic region of parallel fiber stimulation. B, DSE was evoked by a voltage step delivered after the 10th parallel fiber stimulus (top). Traces are averages of three EPSCs at the indicated time (pre, post, rec). C, Peak DSE was calculated as 1 - (EPSCpost /EPSCpre) and plotted versus Capost. DSE was half-maximal at Capost = 14 μm, and the Hill coefficient was 2.5. DSEmax was 0.89. DSEmax and Ca0.5 are indicated by horizontal and vertical dashed lines, respectively. Data in AC were obtained from one cell.
Figure 5.
Figure 5.
Summary of calcium dependence of parallel fiber DSE. A, Data from five cells loaded with fura-2FF. For clarity, peak DSE values from each cell were normalized. Each cell is represented by a different plot symbol. Fits of the Hill equation to the data points from each cell are superimposed. For five cells, half-maximal DSE occurred at peak Capost = 15.3 ± 1.1 μm, cooperativity was 2.3 ± 0.2, and peak DSE was 0.89 ± 0.02. B, Data from five cells loaded with mag-fura-5. Half-maximal DSE occurred at peak Capost = 17.4 ± 1.0 μm, cooperativity was 1.2 ± 0.10, and DSEmax was 0.91 ± 0.02.
Figure 6.
Figure 6.
Calcium dependence of DSE at the climbing fiber to Purkinje cell synapse. A, DSE was evoked with Purkinje cell depolarizations of 200–2000 msec (top), which evoked calcium transients measured in proximal dendrites (bottom). B, EPSCs were evoked at 30 sec intervals. EPSCs marked post and rec were evoked at 5 and 35 sec after thet ermination of the voltage step. C, Peak DSE was calculated for each trial as 1 - (EPSCpost /EPSCpre) and plotted against peak Capost. DSEmax and Ca0.5 are indicated by horizontal and vertical dashed lines, respectively. Data fromA and B were obtained from four consecutive trials. Data from AC were obtained from one cell. In this cell, half-maximal DSE occurred at Capost = 16 μm, cooperativity was 2.6, and DSEmax was 0.68. D, Data from six cells, as obtained in C. Each cell is indicated by a different plot symbol, and fits of the Hill equation for each cell are superimposed. For six cells, half-maximal DSE occurred at peak Capost = 18.5 ± 0.7 μm, cooperativity was 2.0 ± 0.2, and DSEmax was 0.47 ± 0.08.
Figure 7.
Figure 7.
Calcium dependence of DSI at inhibitory synapses on Purkinje cells. A, DSI was evoked by voltage steps of 150–1500 msec (top), and resulting calcium transients are shown below (bottom). B, (top) IPSCs were evokeda t0. 5 Hz. DSI was evoked by voltage steps delivered after the 10th stimulus. C, Peak DSI is plotted against peak Capost for each trial. DSEmax and Ca0.5 areindicated by horizontal and vertical dashed lines, respectively. Data in AC are from one cell. Half-maximal DSI occurred at Ca-post =14.5 μm, the hill coefficient was 1.0, and DSI max was 0.80. D, The relationship between DSI and peak Capost for fourcells. Each cell is represented by a different plot symbol, and fits of data from each cell to the Hill equation are shown. For four cells, half-maximal DSI occurred at peak Capost = 16.0± 0.7 μm, cooperativity was 1.3 ± 0.1, and DSImax was 0.82 ± 0.01.
Figure 8.
Figure 8.
Contributions of the relation ship between Capre and EPSC to the Capost dependence of retrograde inhibition. Aa, Dependence of the EPSC on Capre at parallel fiber synapses, which is described by an equation of the form EPSC = k(Capre)3. Ab, Relationship between PF–DSE and Capost, which is described by DSE = DSEmax/(1 + (Ca0.5/Capost)n). Parameters of this plot are from Figure 5A, with DSEmax = 0.89, Ca0.5 = 15.3, and n = 2.3. Ac, We next used the power law, above, to calculate the relationship between endocannabinoid-mediated inhibition of Capre and Capost. Capre was calculated using Aa and Ab. Maximum inhibition of Capre is 52%, inhibition of Capre is half-maximal with Capost = 20.8 μm, and the Hill coefficient of 2.0. Ba, Dependence of the CF EPSC on Capre, which is described by EPSC = 1.1 (Capren/(Capren + KDn), where n = 4.5 and KD = 0.6 mm (Foster et al., 2002). Bb, The relationship between climbing fiber DSE and Capost from Figure 6D. The relation has the same form as in Ab, and the parameters are DSEmax = 0.47, Ca0.5 = 18.5, and n = 2.0. Bc, As in A of this figure, we determined the relationship between endocannabinoid-mediated inhibition of Capre versus elevation of Capost at climbing fiber synapses. Maximum inhibition of Capre is 42%, inhibition of Capre is half-maximal with Capost = 12.3 μm, and the Hill coefficient is 1.8.

References

    1. Atluri PP, Regehr WG ( 1996) Determinants of the time course of facilitation at the granule cell to Purkinje cell synapse. J Neurosci 16: 5661–5671. - PMC - PubMed
    1. Baylor SM, Hollingworth S ( 1988) Fura-2 calcium transients in frog skeletal muscle fibres. J Physiol (Lond) 403: 151–192. - PMC - PubMed
    1. Beltramo M, Stella N, Calignano A, Lin SY, Makriyannis A, Piomelli D ( 1997) Functional role of high-affinity anandamide transport, as revealed by selective inhibition. Science 277: 1094–1097. - PubMed
    1. Cravatt BF, Giang DK, Mayfield SP, Boger DL, Lerner RA, Gilula NB ( 1996) Molecular characterization of an enzyme that degrades neuromodulatory fatty-acid amides. Nature 384: 83–87. - PubMed
    1. Devane WA, Hanus L, Breuer A, Pertwee RG, Stevenson LA, Griffin G, Gibson D, Mandelbaum A, Etinger A, Mechoulam R ( 1992) Isolation and structure of a brain constituent that binds to the cannabinoid receptor. Science 258: 1946–1949. - PubMed

Publication types

MeSH terms