. 2003 Jun;37(6):621-30.
doi: 10.1080/1071576031000088283.

Phospholipid hydroperoxide glutathione peroxidase induces a delay in G1 of the cell cycle

Affiliations

Phospholipid hydroperoxide glutathione peroxidase induces a delay in G1 of the cell cycle

Hong P Wang et al. Free Radic Res. 2003 Jun.

Abstract

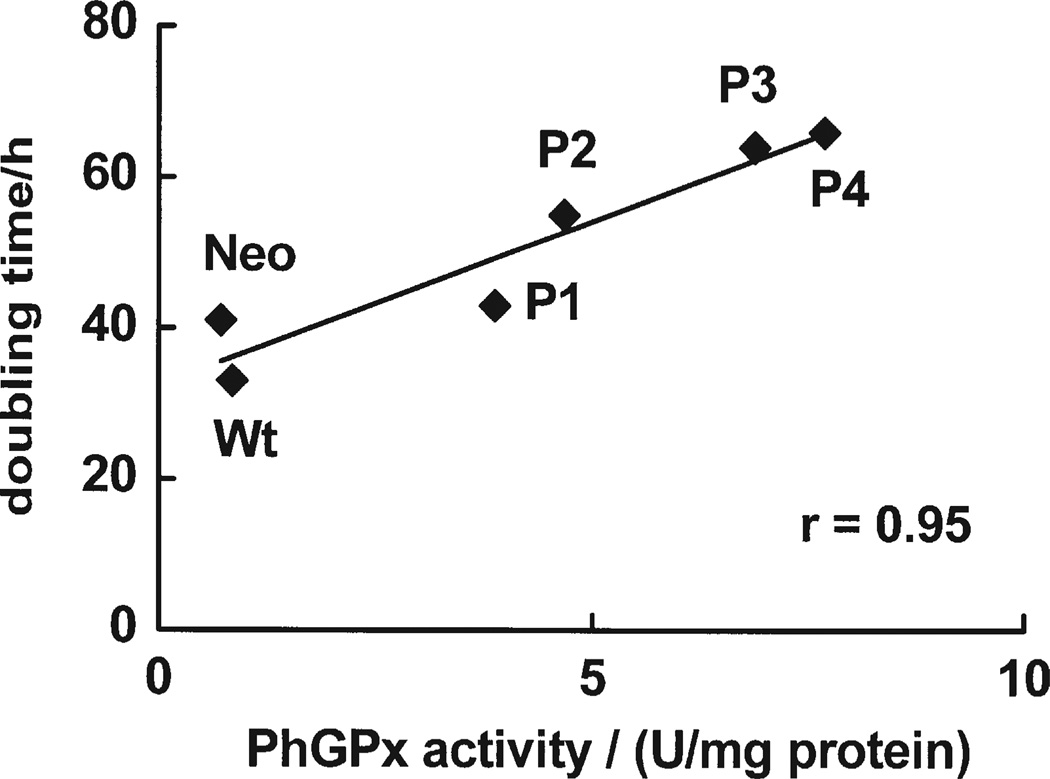
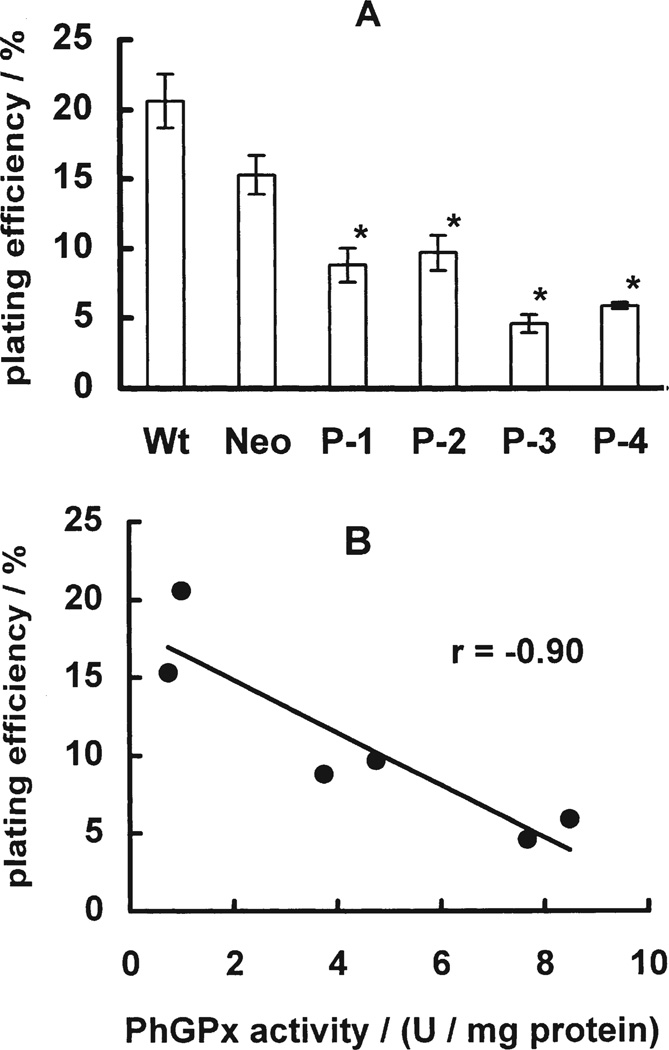
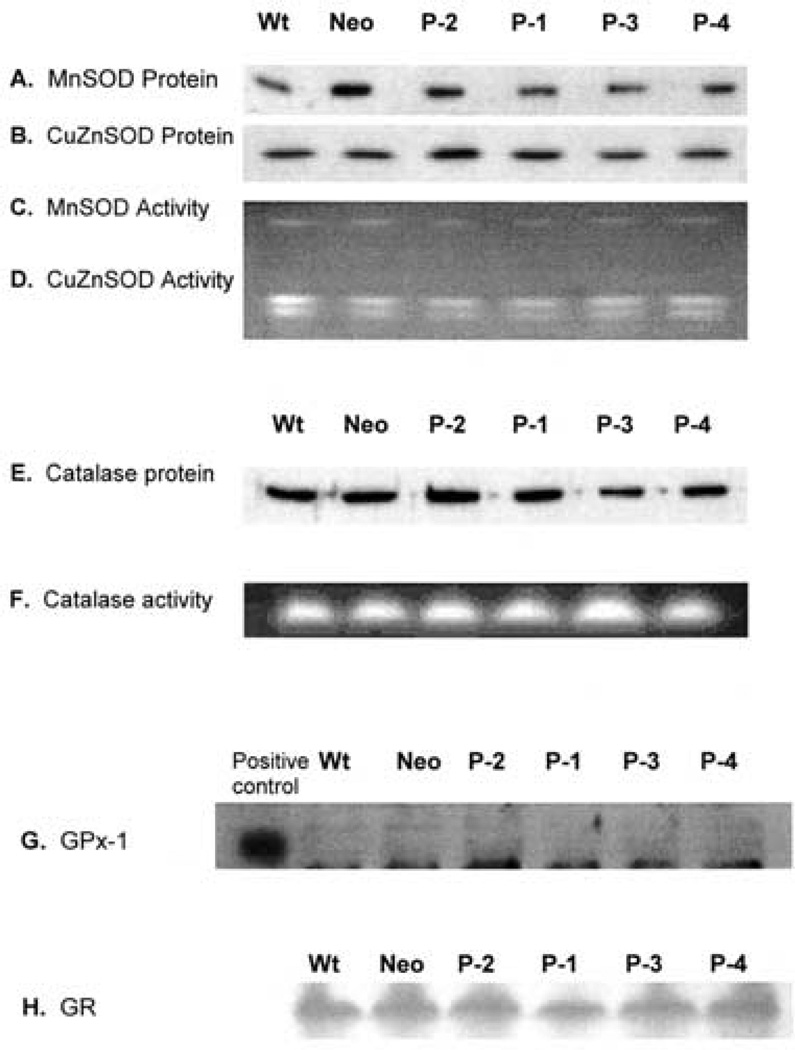
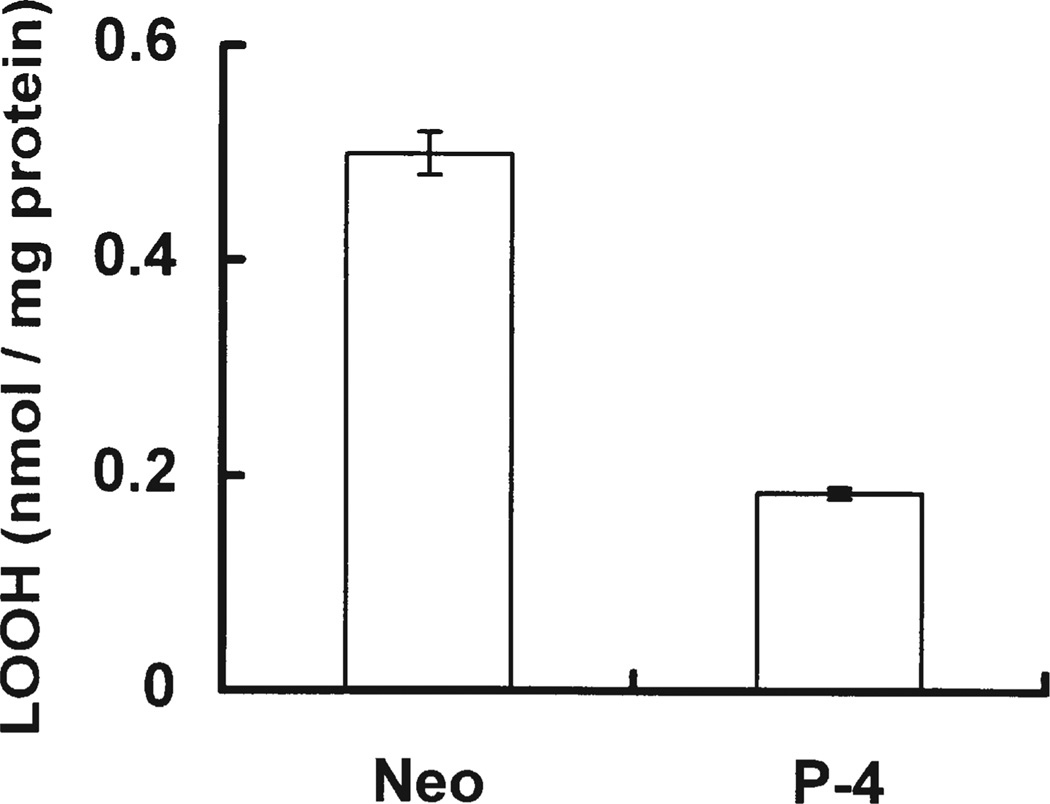
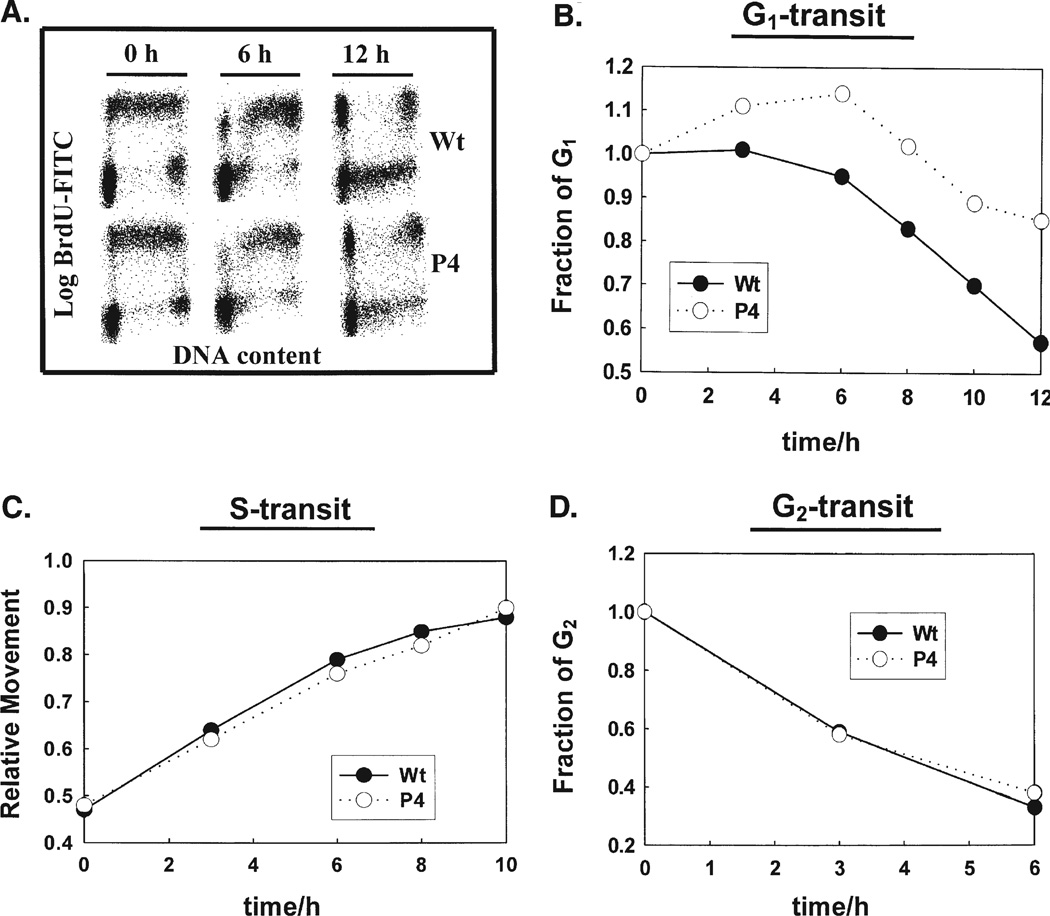
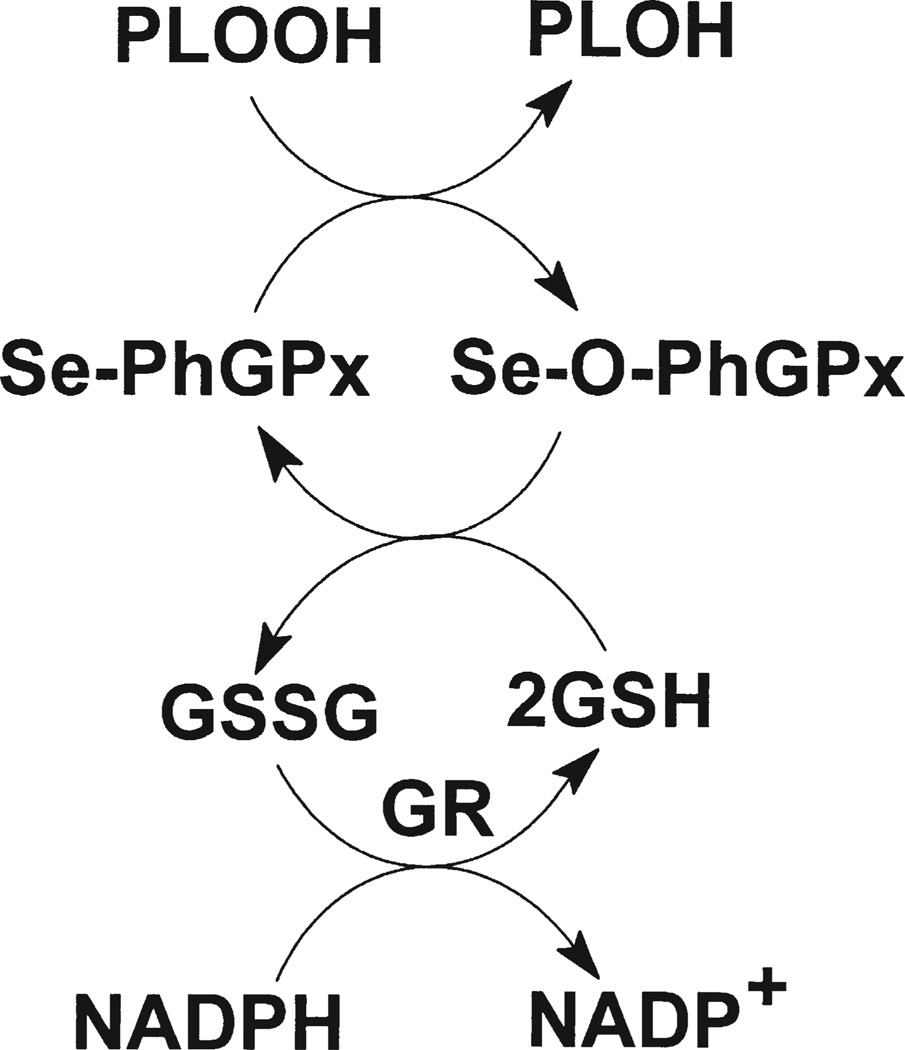
Phospholipid hydroperoxide glutathione peroxidase (PhGPx) is an antioxidant enzyme that reduces cellular phospholipid hydroperoxides (PLOOHs) to alcohols. Cellular peroxide tone has been implicated in cell growth and differentiation. By reducing the PLOOH level in the cell membrane, PhGPx regulates the peroxide tone and thereby might be involved in cell growth. We hypothesized that overexpression of PhGPx in human breast cancer cells would decrease their growth rate. We stably transfected MCF-7 cells (Wt) with L-PhGPx and measured cell doubling time, plating efficiency, and cell cycle phase transit times. P-4 cells (8-fold increase in PhGPx activity) showed a 2-fold increase in doubling time; doubling time increased directly with PhGPx activity (r = 0.95). The higher the PhGPx activity, the lower the plating efficiency (r = -0.86). The profile of other antioxidant enzymes was unchanged. Overexpression of PhGPx lowered the steady-state level of PLOOH (by > 60%). Results from bromodeoxyuridine pulse-chase experiments and flow cytometry indicate that PhGPx induced a delay in MCF-7 proliferation that was primarily due to a slower progression from G1 to S. These results support the hypothesis that PhGPx plays a regulatory role in the progression of MCF-7 cells from G1 to S possibly by regulating the steady-state levels of PLOOH. These data suggest that PhGPx can lower the peroxide tone, which might change the cellular redox environment resulting in a delay in G1 transit. Thus, PhGPx could be an important factor in cell growth.


Figures

FIGURE 1
FIGURE 1
PhGPx inhibits cell growth. The cell doubling time was calculated from the growth curves during exponential growth phase.
FIGURE 2
FIGURE 2
PhGPx decreases plating efficiency. (A) Plating efficiency. Cells were seeded into 60-mm dishes at a certain cell number. After 2 weeks incubation at 37°C, cells were fixed and stained. Colonies containing more than 50 cells were counted. The plating efficiency (PE) was calculated as: PE = (Colonies formed/number of cells seeded) × 100%. Data are mean ± SE, n = 3; *p < 0.05 compared to Wt. (B) Correlation of plating efficiency and PhGPx activity. Data are derived from Fig. 2A and Table I.
FIGURE 3
FIGURE 3
PhGPx does not alter the levels of MnSOD, CuZnSOD, CAT or GPx-1 in MCF-7 cells. (A) Western blot for MnSOD. Total cellular protein (30µg) was electrophoresed on a 12.5% SDS-polyacrylamide gel and detected using anti-human MnSOD polyclonal antibody. (B) Western blot for CuZnSOD. Total cellular protein (30 µg) was electrophoresed on a 12.5% SDS-polyacrylamide gel and detected using anti-human CuZnSOD polyclonal antibody. (C and D) In gel activity assay for MnSOD and CuZnSOD. Total cellular protein (200µg) was electrophoresed on a 12% native gel, followed by incubation in nitroblue tetrazolium (NBT) and riboflavin-TEMED solution. The gel was washed with water and illuminated under a bright fluorescent light. Achromatic bands indicate the presence of SOD.(E).Western blot for catalase. Total cellular protein (30µg) was electrophoresed on a 12.5% SDS-polyacrylamide gel, and detected by the anti-human catalase polyclonal antibody. (F) In gel activity assay for catalase. Total cellular protein (30µg) was electrophoresed on a 12% native gel, followed by incubation with 0.003% H2O2. The activity of catalase was determined by staining the gel with ferric chloride and potassium ferricyanide. (G) The native immunoblotting assay for GPx-1. Total cellular protein (700µg) was separated on a 12% native gel. After transferring onto a nitrocellulose membrane, GPx-1 was detected by a polyclonal antibody against human GPx-1. (H) In gel activity assay for GR. Cellular protein (500µg) was separated onto a 12% native gel. GR activity was detected by staining the gel with 3.4 mM GSSG, 0.36 mM NADPH, 0.052mM dichlorophenol–indophenol, and 1.1mM 3(4,5-dimethythiazolyl-2)-2,5-diphenyl tetrazolium. Data are representative of three independent experiments.
FIGURE 4
FIGURE 4
PhGPx influences the steady-state level of cellular PLOOHs. Neo and P-4 cells were grown on 100-mm dishes to 80% confluence. Cellular lipids were extracted with chloroform/methanol (2:1, v/v). The chloroform layer was used for PLOOH determination using the Cayman Lipid Hydroperoxide Assay Kit. Total PLOOHs were normalized to total cellular protein. Data are mean, n = 2, the bars represent the range.
FIGURE 5
FIGURE 5
PhGPx overexpressing MCF-7 cells show a G1-delay : Asynchronously growing, monolayer cultures of MCF-7 and P-4 cells were pulse-labeled with BrdU. At representative times, cells were harvested by trypsinization and fixed in 70% ethanol. Cell cycle progression was measured by indirect immunostaining of BrdU-labeled cells and flow cytometry. (A) BrdU-positive (S phase) and BrdU-negative (G1 and G2 phases) cells were distinguished by density plots of cell cycle phase distributions at 0, 6 and 12 h after BrdU-labeling. PI vs BrdU-FITC flow cytometer histograms were determined. Changes in DNA content were used as a measure of movement of cells through the cell cycle. (B) Progression through G1. In Wt cells, the fraction of cells in G1 continuously decreased as these cells moved into S. In contrast, the fraction of P-4 cells in G1 increased slightly 2–6 h after BrdU labeling, followed by a gradual drop as cells entered S-phase. (C) Progression through S into G2 was evaluated by measuring the relative movement (RM) parameter. (D) The exit of cells from G2 in wild type and PhGPx overexpressing cell lines.
SCHEME 1
SCHEME 1
Overview of the mechanism for the conversion of phospholipid hydroperoxides to their corresponding alcohols by PhGPx and the glutathione system.

References

    1. Ursini F, Maiorino M, Gregolin C. The selenoenzyme phospholipid hydroperoxide glutathione peroxidase. Biochim. Biophys. Acta. 1985;839:62–70. - PubMed
    1. Thomas JP, Maiorino M, Ursini F, Girotti AW. Protective action of phospholipid hydroperoxide glutathione peroxidase against membrane-damaging lipid peroxidation in situ reduction of phospholipid and cholesterol hydroperoxides. J. Biol. Chem. 1990;265:454–461. - PubMed
    1. Pushpa-Rekha TR, Burdsall AL, Oleksa LM, Chisolm GM, Driscoll DM. Rat phospholipid-hydroperoxide glutathione peroxidase. cDNA cloning and identification of multiple transcription and translation start sites. J. Biol. Chem. 1995;270:26993–26999. - PubMed
    1. Weitzel F, Wendel A. Selenoenzymes regulate the activity of leukocyte 5-lipoxygenase via the peroxide tone. J. Biol. Chem. 1993;268:6288–6292. - PubMed
    1. Schnurr K, Belkner J, Ursini F, Schewe T, Kuhn H. The selenoenzyme phospholipid hydroperoxide glutathione peroxidase controls the activity of the 15-lipoxygenase with complex substrates and preserves the specificity of the oxygenation products. J. Biol. Chem. 1996;271:4653–4658. - PubMed

Publication types

MeSH terms

LinkOut - more resources