Comparative Study
. 2003 May-Jun;5(3):218-28.
doi: 10.1016/S1476-5586(03)80054-4.

Malignancy-associated regions of transcriptional activation: gene expression profiling identifies common chromosomal regions of a recurrent transcriptional activation in human prostate, breast, ovarian, and colon cancers

Affiliations
Comparative Study

Malignancy-associated regions of transcriptional activation: gene expression profiling identifies common chromosomal regions of a recurrent transcriptional activation in human prostate, breast, ovarian, and colon cancers

Gennadi V Glinsky et al. Neoplasia. 2003 May-Jun.

Abstract

Despite remarkable advances in our understanding of a genetic basis of cancer, the precise molecular definition of the phenotypically relevant genetic features associated with human epithelial malignancies remains a significant and highly relevant challenge. Here we performed a systematic analysis of the chromosomal positions of cancer-associated transcripts for prostate, breast, ovarian, and colon tumors, and identified short segments of human chromosomes that appear to represent a common target for transcriptional activation in major epithelial malignancies in human. These cancer-associated transcriptomeres correspond well to the regions of transient transcriptional activity on chromosomes 1q21-q23 (144-160 Mbp), 12q13 (52-63 Mbp), 17q21 (38-50 Mbp), 17q23-q25 (72-82 Mbp), 19p13 (1-16 Mbp), and Xq28 (132-142 Mbp) during human cell cycle, suggesting a common epigenetic mechanism of transcriptional activation. Consistent with this idea, two of these transcriptomeres (12q13 and 17q21) seemed to be related to the p53-regulated transcriptional clusters, and some of the cancer-associated transcriptomeres appeared to correspond well to the recently identified regions of increased gene expression on human chromosomes.


Figures
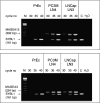
Figure 1
Figure 1
RT-PCR confirmation analysis of the upregulation of two genes representing Xq28 transcription activation cluster in human prostate carcinoma cell lines [MAGEA12 (top panel) and MAGEA3 transcripts (bottom panel)]. Standard RT-PCR protocol was used to amplify fragments of corresponding genes from mRNA of the normal human prostate epithelial cells (PrEc) and highly metastatic PC3MLN4 and LNCaPLN3 human prostate carcinoma cell lines. To control PCR amplification efficiency and loading, the experiments were carried out using coamplification in the same tube with each experimental gene of a fragment of control gene (SYBL1) that was selected to have a similar chromosomal location but distinct amplification product size and regulation pattern. In the control experiments (C), PCR amplification was carried out only for corresponding control genes. H2O—negative control of PCR amplification; M—molecular weight markers.
Figure 2
Figure 2
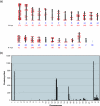
Genome-wide representation of distribution of transcription activation clusters within a PC3MLN4/LNCaPLN3 consensus class of 165 genes with increased mRNA abundance levels. The clustering effect in the experimental data set was calculated as a ratio of the average random clustering distance to the individual measurements of the experimental clustering distance within a given class of differentially regulated transcripts. Higher ratio due to a shorter experimental clustering distance was interpreted as more significant clustering effect. The cutoff value for identification of the transcription activation clusters was set to exceed the expected random density of gene distribution by at least 10-fold. The random distribution of the individual clustering distances (d) was obtained by performing similar analysis for the random gene set (a total of 105 individual measurements). There were no random pseudo-clusters exceeding the cutoff value that was set for identification of the transcription activation clusters. Note that for more accurate visual comparisons of the clustering effects within experimental and random gene sets, (a) and (b) scaled to the different Y-axis values, and (c) and (d) scaled to the same Y-axis value. A similar analysis of a genome-wide distribution of transcription activation clusters was performed for genes upregulated in ovarian (Figure 1S), breast (Figure 2S), and colon (Figure 3S) cancers as well as genes activated during human cell cycle (Figures 4S and 5S), dsRNA-induced transcripts (Figure 6S), and p53-regulated genes (Figures 7S). These data are presented in the supplement.
Figure 2
Figure 2
Genome-wide representation of distribution of transcription activation clusters within a PC3MLN4/LNCaPLN3 consensus class of 165 genes with increased mRNA abundance levels. The clustering effect in the experimental data set was calculated as a ratio of the average random clustering distance to the individual measurements of the experimental clustering distance within a given class of differentially regulated transcripts. Higher ratio due to a shorter experimental clustering distance was interpreted as more significant clustering effect. The cutoff value for identification of the transcription activation clusters was set to exceed the expected random density of gene distribution by at least 10-fold. The random distribution of the individual clustering distances (d) was obtained by performing similar analysis for the random gene set (a total of 105 individual measurements). There were no random pseudo-clusters exceeding the cutoff value that was set for identification of the transcription activation clusters. Note that for more accurate visual comparisons of the clustering effects within experimental and random gene sets, (a) and (b) scaled to the different Y-axis values, and (c) and (d) scaled to the same Y-axis value. A similar analysis of a genome-wide distribution of transcription activation clusters was performed for genes upregulated in ovarian (Figure 1S), breast (Figure 2S), and colon (Figure 3S) cancers as well as genes activated during human cell cycle (Figures 4S and 5S), dsRNA-induced transcripts (Figure 6S), and p53-regulated genes (Figures 7S). These data are presented in the supplement.
Figure 3
Figure 3
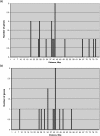
Profiles of the chromosomal distribution of human breast cancer-associated transcripts (a), dsRNA-induced genes (b), and cell cycle-activated genes (c) residing on chromosome 17. A total of 132 estrogen receptor-negative breast cancer-associated transcripts was obtained from Ref. [5] by combining the lists of genes comprising basal epithelial cell clusters 1 and 2, Erb-B2 overexpression cluster, and a proliferative cluster. A total of 144 ovarian cancer-associated transcripts was derived from Ref. [6] as a sum of the top 100 biomarker genes, proliferative and tumor clusters. The redundant entries were eliminated from the final gene lists. A total of 165 prostate cancer-associated transcripts was identified by comparing gene expression profiles of two human prostate carcinoma cell lines (PC3MLN4 and LNCaPLN3) to the gene expression pattern of cultured normal human prostate epithelial cells using the Affymetrix GeneChip system. A concordant set of 165 genes upregulated in cancer cell lines was generated utilizing the Affymetrix software for pairwise comparisons of duplicate cancer mRNA samples from each cell line versus a triplicate normal mRNA samples derived from two different normal prostate epithelial cell lines. Thus, each differentially expressed gene was required to be called in the same direction in 12 pairwise comparisons. The list of 378 genes comprising the human cell cycle transcriptome was obtained from Ref. [19]. The list of the dsRNA-induced genes was derived from Ref. [20]. RH mapping data were retrieved using the LocusLink database and utilized to generate the chromosome-specific map of gene distribution. One unit value on the Y-axis corresponds to a single gene with a placement resolution of 1 Mb along the length of the chromosome. The complete lists of genes and RH mapping data are presented in the supplement (Tables 1S-8S).
Figure 3
Figure 3
Profiles of the chromosomal distribution of human breast cancer-associated transcripts (a), dsRNA-induced genes (b), and cell cycle-activated genes (c) residing on chromosome 17. A total of 132 estrogen receptor-negative breast cancer-associated transcripts was obtained from Ref. [5] by combining the lists of genes comprising basal epithelial cell clusters 1 and 2, Erb-B2 overexpression cluster, and a proliferative cluster. A total of 144 ovarian cancer-associated transcripts was derived from Ref. [6] as a sum of the top 100 biomarker genes, proliferative and tumor clusters. The redundant entries were eliminated from the final gene lists. A total of 165 prostate cancer-associated transcripts was identified by comparing gene expression profiles of two human prostate carcinoma cell lines (PC3MLN4 and LNCaPLN3) to the gene expression pattern of cultured normal human prostate epithelial cells using the Affymetrix GeneChip system. A concordant set of 165 genes upregulated in cancer cell lines was generated utilizing the Affymetrix software for pairwise comparisons of duplicate cancer mRNA samples from each cell line versus a triplicate normal mRNA samples derived from two different normal prostate epithelial cell lines. Thus, each differentially expressed gene was required to be called in the same direction in 12 pairwise comparisons. The list of 378 genes comprising the human cell cycle transcriptome was obtained from Ref. [19]. The list of the dsRNA-induced genes was derived from Ref. [20]. RH mapping data were retrieved using the LocusLink database and utilized to generate the chromosome-specific map of gene distribution. One unit value on the Y-axis corresponds to a single gene with a placement resolution of 1 Mb along the length of the chromosome. The complete lists of genes and RH mapping data are presented in the supplement (Tables 1S-8S).
Figure 4
Figure 4
Cancer-associated transcriptomeres located on chromosome 11 correspond well to the region of increased gene expression identified on human chromosome 11 [4]. The experimental protocols are described in the legends to Figures 1–3 and in the Materials and Methods section. The distribution of regions of increased gene expression and gene density along human chromosome 11 are shown in the box and originally described in Ref. [4].

Similar articles

Cited by

References

    1. Hanahan D, Weinberg RA. The hallmarks of cancer. Cell. 2000;100:57–70. - PubMed
    1. Pollack JR, Perou CM, Alizadeh AA, Eisen MB, Pergamenschikov A, Welsh J, Jeffrey SS, Botstein D, Brown PO. Genome-wide analysis of DNA-copy number changes using cDNA microarrays. Nat Genet. 1999;23:41–46. - PubMed
    1. Forozan F, Mahlamaki EH, Monni O, Chen Y, Veldman R, Jiang Y, Gooden GC, Ethier SP, Kallioniemi A, Kallioniemi O-P. Comparative genomic hybridization analysis of 38 breast cancer cell lines: a basis for interpreting complementary DNA microarray data. Cancer Res. 2000;60:4519–4525. - PubMed
    1. Caron H, van Schaik B, van der Mee M, Baas F, Riggins G, van Stuis P, Hermus M-C, van Asperen R, Boon K, Voute PA, Heisterkamp S, van Kampen A, Versteeg R. The human transcriptome map: clustering of highly expressed genes in chromosomal domains. Science. 2001;291:1289–1292. - PubMed
    1. Perou CM, Sorlie T, Eisen MB, van de Rijn M, Jeffrey SS, Rees CA, Pollack JR, Ross DT, Johnsen H, Akslen LA, Fluge O, Pergamenschikov A, Williams C, Zhu SX, Lonning PE, Borresen-Dale AL, Brown PO, Botstein D. Molecular portrait of human breast tumors. Nature. 2000;406:747–752. - PubMed

Publication types