

Gene prediction by spectral rotation measure: a new method for identifying protein-coding regions
- PMID: 12869578
- PMCID: PMC403785
- DOI: 10.1101/gr.1261703
Gene prediction by spectral rotation measure: a new method for identifying protein-coding regions
Abstract
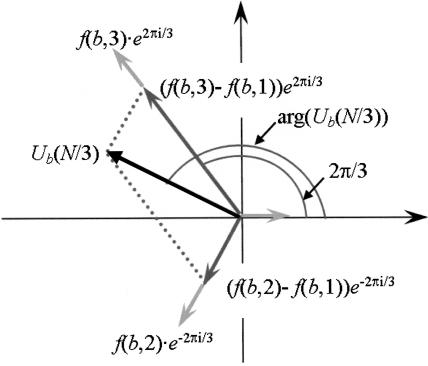
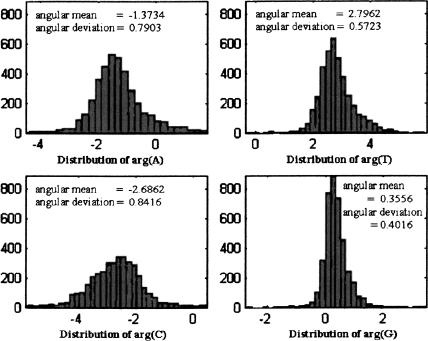
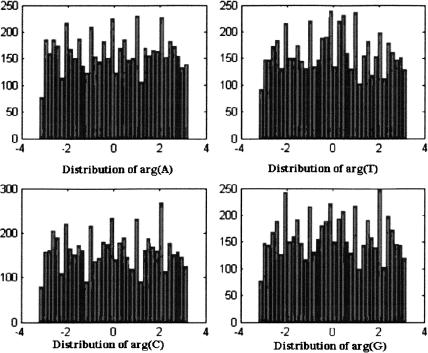
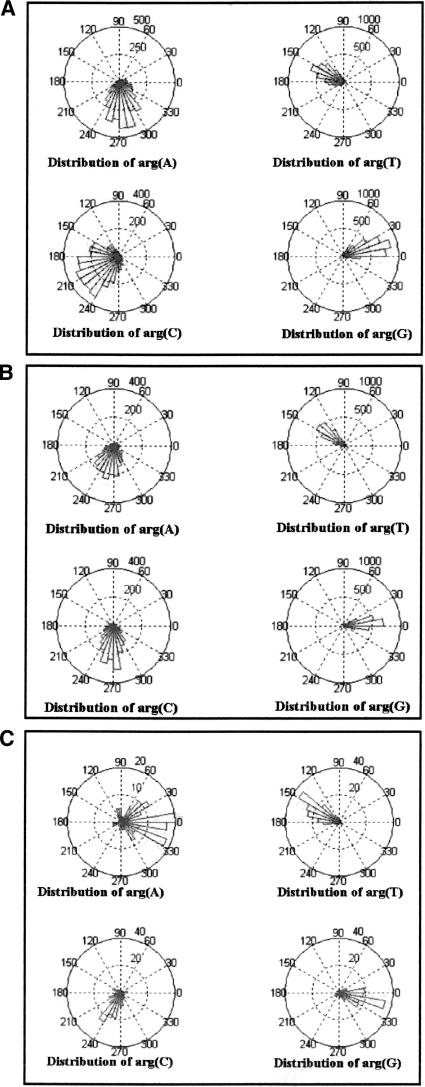
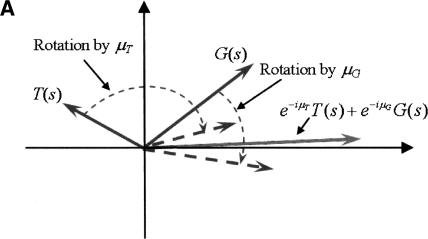
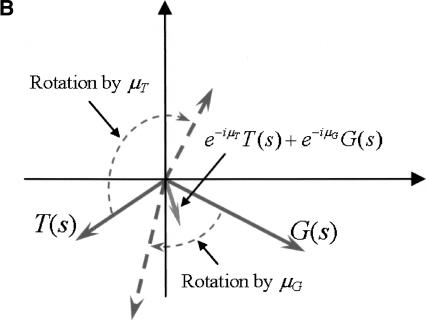
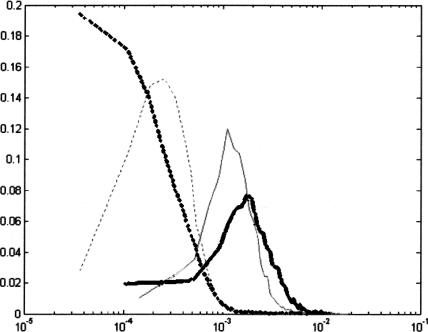
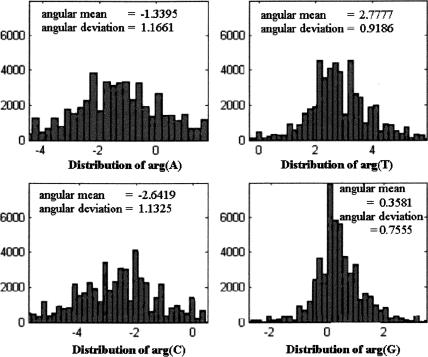
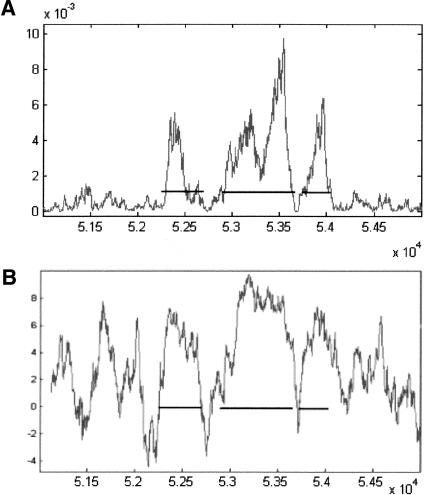
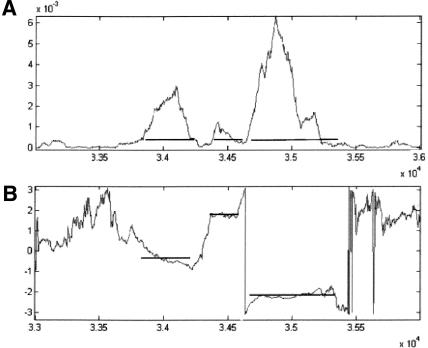
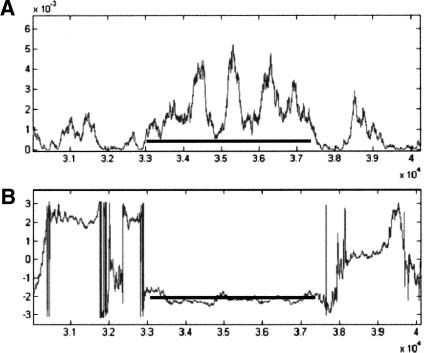
A new measure for gene prediction in eukaryotes is presented. The measure is based on the Discrete Fourier Transform (DFT) phase at a frequency of 1/3, computed for the four binary sequences for A, T, C, and G. Analysis of all the experimental genes of S. cerevisiae revealed distribution of the phase in a bell-like curve around a central value, in all four nucleotides, whereas the distribution of the phase in the noncoding regions was found to be close to uniform. Similar findings were obtained for other organisms. Several measures based on the phase property are proposed. The measures are computed by clockwise rotation of the vectors, obtained by DFT for each analysis frame, by an angle equal to the corresponding central value. In protein coding regions, this rotation is assumed to closely align all vectors in the complex plane, thereby amplifying the magnitude of the vector sum. In noncoding regions, this operation does not significantly change this magnitude. Computing the measures with one chromosome and applying them on sequences of others reveals improved performance compared with other algorithms that use the 1/3 frequency feature, especially in short exons. The phase property is also used to find the reading frame of the sequence.
Figures
References
-
- Almagor, H. 1985. Nucleotide distribution and the recognition of coding regions in DNA sequences: An information theory approach. J. Theor. Biol. 117: 127-136. - PubMed
-
- Anastassiou, D. 2000. Frequency-domain analysis of biomolecular sequences. Bioinformatics 16: 1073-1082. - PubMed
-
- Baldi, P. and Brunak S. 2001. Bioinformatics: The machine learning approach 2nd ed., chapter 7. MIT Press, Cambridge, MA.
-
- Borodovsky, M.Y., Sprizhitsky, Y.A., Golovanov, E.I., and Alexandrov, A.A. 1986. Statistical patterns in the primary structure of the functional regions of the Escherichia coli genome. II. Nonuniform Markov models. Mol. Biol. 20: 833-840.
-
- Borodovsky, M.Y., Koonin, E.V., and Rudd, K.E. 1994. New genes in old sequence: A strategy for finding genes in the bacterial genome. Trends Biochem. Sci. 19: 309-313. - PubMed
WEB SITE REFERENCES
-
- http://www.ncbi.nlm.nih.gov/GenBank; National Center for Biotechnology Information.
MeSH terms
Substances
LinkOut - more resources
Full Text Sources