Comparative Study
. 2003 Aug;13(8):1787-99.
doi: 10.1101/gr.1555203. Epub 2003 Jul 17.

Integrated mapping, chromosomal sequencing and sequence analysis of Cryptosporidium parvum

Affiliations
Comparative Study

Integrated mapping, chromosomal sequencing and sequence analysis of Cryptosporidium parvum

Alan T Bankier et al. Genome Res. 2003 Aug.

Erratum in

  • Genome Res. 2004 Feb;14(2):327

Abstract

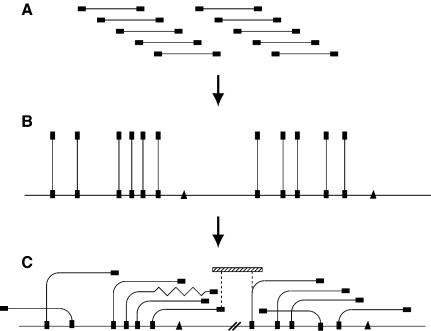
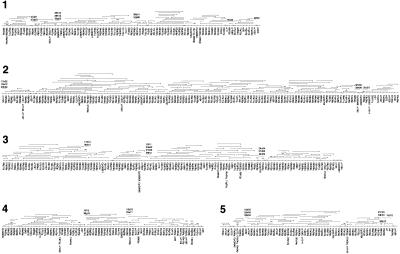
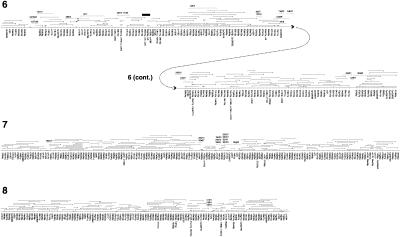
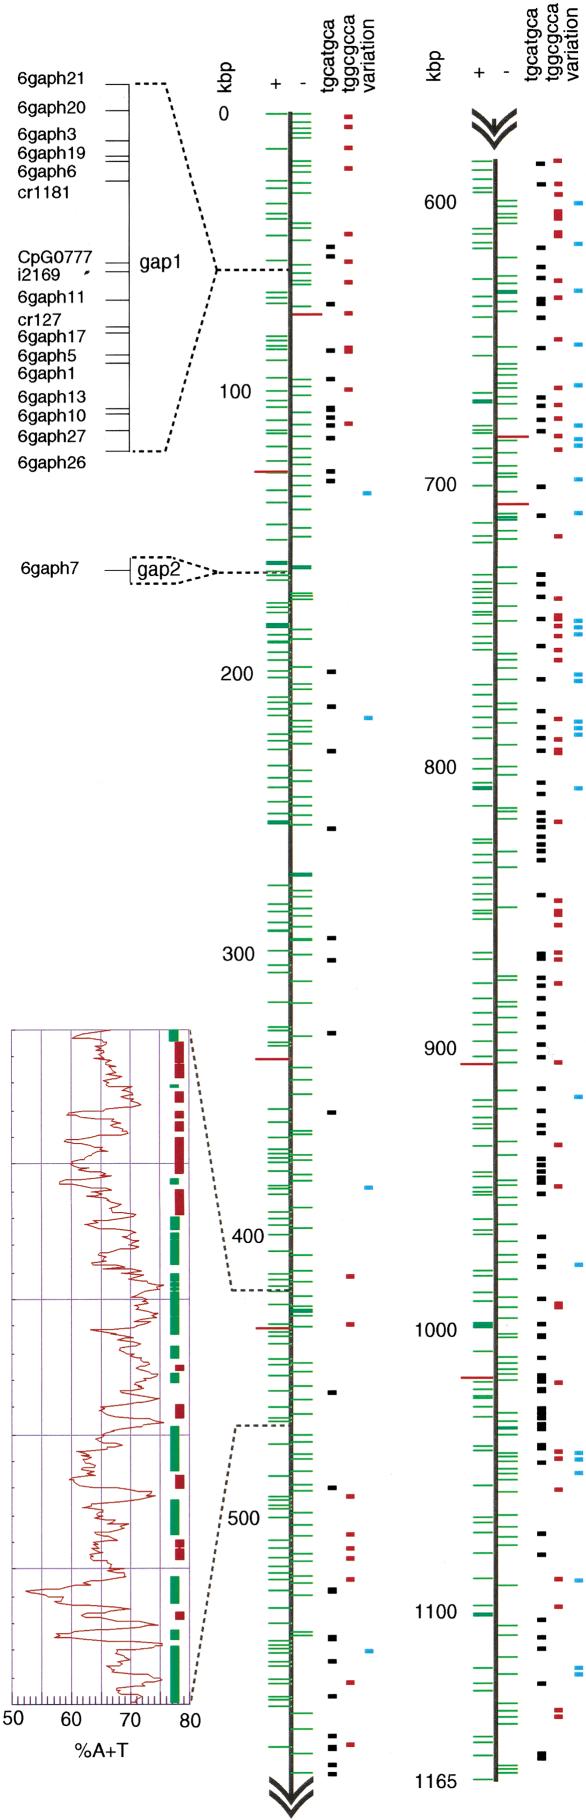
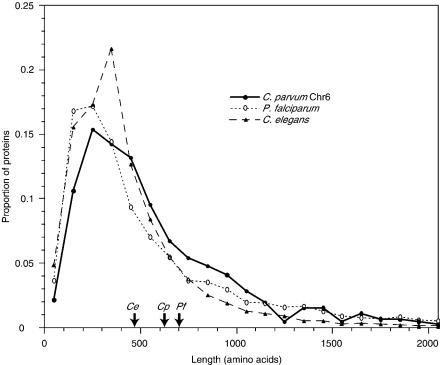
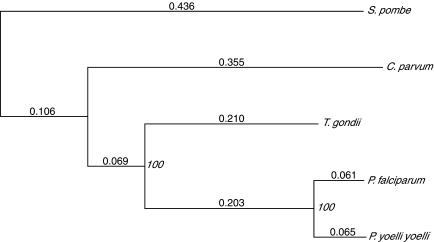
The apicomplexan Cryptosporidium parvum is one of the most prevalent protozoan parasites of humans. We report the physical mapping of the genome of the Iowa isolate, sequencing and analysis of chromosome 6, and approximately 0.9 Mbp of sequence sampled from the remainder of the genome. To construct a robust physical map, we devised a novel and general strategy, enabling accurate placement of clones regardless of clone artefacts. Analysis reveals a compact genome, unusually rich in membrane proteins. As in Plasmodium falciparum, the mean size of the predicted proteins is larger than that in other sequenced eukaryotes. We find several predicted proteins of interest as potential therapeutic targets, including one exhibiting similarity to the chloroquine resistance protein of Plasmodium. Coding sequence analysis argues against the conventional phylogenetic position of Cryptosporidium and supports an earlier suggestion that this genus arose from an early branching within the Apicomplexa. In agreement with this, we find no significant synteny and surprisingly little protein similarity with Plasmodium. Finally, we find two unusual and abundant repeats throughout the genome. Among sequenced genomes, one motif is abundant only in C. parvum, whereas the other is shared with (but has previously gone unnoticed in) all known genomes of the Coccidia and Haemosporida. These motifs appear to be unique in their structure, distribution and sequences.


Figures

Figure 1
Figure 1
Construction of HAPPily-anchored physical map. (A) Members of a genomic PAC library are end-sequenced (filled rectangles). (B) One end-sequence of each clone is HAPPY-mapped to establish its position in the genome; additional sequence-tagged sites (triangles) are also mapped. (C) Overlaps between nearby clones are determined, by using PCR to test each clone for its content of nearby mapped markers, creating contigs. Chimeric clones or deletions (zigzag line) become apparent. The orientations of contigs which are separated by uncloned portions (heavy parallel diagonal lines) are known from the HAPPY map, and additional linking clones (hatched rectangle) can be sought by screening the same or other libraries with the markers adjacent to the gap (dashed vertical lines).
Figure 2
Figure 2
Genome-wide HAPPily anchored physical map. For clarity, markers are shown equally spaced. For each chromosome, HAPPY marker names are given below the map; names beginning `cr' and `CpG' indicate markers taken from Piper et al. (1998a) and from database sequences, respectively. Other names represent PAC end-sequences in condensed form; `q' = SP6 end, `p' = T7 end; for example, 06f03q is the SP6 end of the PAC clone pica_0006_f03. PAC clones are shown above each chromosome; the clone end represented by the mapped marker is indicated by a triangle; a short vertical line at the opposite end of a clone indicates that it ends within the interval shown; lack of this vertical line indicates that the clone may extend further than shown. Additional PAC or BAC clones identified during preliminary gap closure are indicated by dashed lines with the condensed clone name above them (names prefixed with `b' are BAC clones). Physical gaps are indicated by paired diagonal lines; the order of segments between these gaps is determined by the HAPPY data; the orientation of some of the smallest segments is not rigorously determined. Chromosome 6 is depicted in two parts; clone b3b01 is shown on both parts to illustrate the overlap. Solid triangles indicate deletions in clones; the solid black rectangle indicates a region of chromosome 6 which was sequenced by PCR amplification based on the corresponding part of the Moredun isolate genome (see text).
Figure 2
Figure 2
Genome-wide HAPPily anchored physical map. For clarity, markers are shown equally spaced. For each chromosome, HAPPY marker names are given below the map; names beginning `cr' and `CpG' indicate markers taken from Piper et al. (1998a) and from database sequences, respectively. Other names represent PAC end-sequences in condensed form; `q' = SP6 end, `p' = T7 end; for example, 06f03q is the SP6 end of the PAC clone pica_0006_f03. PAC clones are shown above each chromosome; the clone end represented by the mapped marker is indicated by a triangle; a short vertical line at the opposite end of a clone indicates that it ends within the interval shown; lack of this vertical line indicates that the clone may extend further than shown. Additional PAC or BAC clones identified during preliminary gap closure are indicated by dashed lines with the condensed clone name above them (names prefixed with `b' are BAC clones). Physical gaps are indicated by paired diagonal lines; the order of segments between these gaps is determined by the HAPPY data; the orientation of some of the smallest segments is not rigorously determined. Chromosome 6 is depicted in two parts; clone b3b01 is shown on both parts to illustrate the overlap. Solid triangles indicate deletions in clones; the solid black rectangle indicates a region of chromosome 6 which was sequenced by PCR amplification based on the corresponding part of the Moredun isolate genome (see text).
Figure 3
Figure 3
C. parvum chromosome 6. The chromosome is shown in two halves (heavy vertical lines). Start points of predicted coding sequences on the + and - strands of the chromosome are indicated by short green horizontal lines to the left and right, respectively (red: tRNA genes). Octamer palindrome motifs are indicated by short black (TGCATGCA) and red (TGGCGCCA) bars, respectively, polymorphisms by blue bars. Two gaps in the sequence are indicated, and the STS markers mapped within them are shown in expanded form (upper left). The A+T content (sliding window of 100 bp) of a representative 50-kbp segment of the chromosome is shown in expanded form (graph, lower left), aligned with protein-coding regions on the + (green bars) and - (red bars) strands.
Figure 4
Figure 4
Distribution of protein lengths. Predicted lengths of proteins on chromosome 6 of C. parvum and in the complete genomes of P. falciparum and C. elegans were sorted into size-bins of 100 amino acids, and the proportion of proteins in each bin were plotted for each species. Proteins longer than 2100 amino acids are not shown; the arrows on the x-axis indicate the arithmetic mean length of all proteins in each of the three species.
Figure 5
Figure 5
Gene Ontology (GO) classifications of proteins. Classification of predicted genes on C. parvum chromosome 6 is compared with that of P. falciparum genes under (A) `Biological process' and (B) `Molecular function' ontologies. Classification of Plasmodium proteins is based on Gardner et al. (2002).
Figure 6
Figure 6
Protein sequence-based phylogenetic tree. The tree was calculated from the aligned and concatenated sequences of four proteins from the five species indicated. Branch lengths are distances calculated using PAM matrices; bootstrap values are indicated at nodes. The proteins used and (in brackets) the gene name on C. parvum chromosome 6 and the GenBank identifiers for their sequences from P. falciparum, P. yoelii yoelii, S. pombe, and T. gondii, respectively, are as follows: protein disulphide isomerase (56K11, 23612738, 23481103, 19113783, 14494995); glyceraldehyde-3-phosphate dehydrogenase (1MB519, 23509820, 23491258, 19112028, 13377044); heat shock protein 60 (1MB751, 23507957, 23479768, 19113806, 5052052); and protein phosphatase 2b (1MB598, 23612977, 23489838, 19112970, 22535354).
Figure 7
Figure 7
Normalized chaos plots for apicomplexan genomes. Each pixel represents the frequency of a given octamer sequence in the genome, relative to the frequency expected in a randomly ordered sequence with the same base composition as the genome in question (log scale; green <10-6; grayscale black through white =10-6 through 5; red >5). In each plot, the octamers [G]8, [C]8, [A]8, and [T]8 are represented at the top left, top right, bottom left, and bottom right corners, respectively.

References

    1. Akiyoshi, D.E., Feng, X., Buckholt, M.A., Widmer, G., and Tzipori, S. 2002. Genetic analysis of a Cryptosporidium parvum human genotype 1 isolate passaged through different host species. Infect. Immun. 70: 5670-5675. - PMC - PubMed
    1. Apweiler, R., Attwood, T.K., Bairoch, A., Bateman, A., Birney, E., Biswas, M., Bucher, P., Cerutti, L., Corpet, F., Croning, M.D., et al. 2000. InterPro—An integrated documentation resource for protein families, domains and functional sites. Bioinformatics 16: 1145-1150. - PubMed
    1. Armson, A., Meloni, B.P., Reynoldson, J.A., and Thompson, R.C.A. 1999. Assessment of drugs against Cryptosporidium parvum using a simple in vitro screening method. FEMS Microbiol. Lett. 178: 227-233. - PubMed
    1. Ashburner, M., Ball, C.A., Blake, J.A., Botstein, D., Butler, H., Cherry, J.M., Davis, A.P., Dolinski, K., Dwight, S.S., Eppig, J.T., et al. 2000. Gene ontology: Tool for the unification of biology. Nat. Genet. 25: 25-29. - PMC - PubMed
    1. Bateman, A., Birney, E., Cerruti, L., Durbin, R., Etwiller, L., Eddy, S.R., Griffiths-Jones, S., Howe, K.L., Marshall, M., and Sonnhammer, E.L. 2002. The Pfam protein families database. Nucleic Acids Res. 30: 276-280. - PMC - PubMed

WEB SITE REFERENCES

    1. http://www.ncbi.nlm.nih.gov/Taxonomy/taxonomyhome.html/; NCBI Taxonomy Homepage.
    1. http://www.sanger.ac.uk/Projects/E_tenella/; The Sanger Institute Eimeria tenella Genome Project.
    1. http://www.tigr.org/tdb/e2k1/tga1/; The TIGR Toxoplasma gondii Genome Project.
    1. http://mips.gsf.de/cgi-bin/proj/medgen/mitofilter; MITOP—Description of MITOP.
    1. http://gecco.org.chemie.uni-frankfurt.de/pats/pats-index.ph; Modlab—The Molecular Design Laboratory.

Publication types

MeSH terms

Associated data