. 2003 Aug 1;17(15):1855-69.
doi: 10.1101/gad.1102803. Epub 2003 Jul 17.

Regulated recruitment of HP1 to a euchromatic gene induces mitotically heritable, epigenetic gene silencing: a mammalian cell culture model of gene variegation

Affiliations

Regulated recruitment of HP1 to a euchromatic gene induces mitotically heritable, epigenetic gene silencing: a mammalian cell culture model of gene variegation

Kasirajan Ayyanathan et al. Genes Dev. .

Abstract

Heterochromatin protein 1 (HP1) is a key component of constitutive heterochromatin in Drosophila and is required for stable epigenetic gene silencing classically observed as position effect variegation. Less is known of the family of mammalian HP1 proteins, which may be euchromatic, targeted to expressed loci by repressor-corepressor complexes, and retained there by Lys 9-methylated histone H3 (H3-MeK9). To characterize the physical properties of euchromatic loci bound by HP1, we developed a strategy for regulated recruitment of HP1 to an expressed transgene in mammalian cells by using a synthetic, hormone-regulated KRAB repression domain. We show that its obligate corepressor, KAP1, can coordinate all the machinery required for stable gene silencing. In the presence of hormone, the transgene is rapidly silenced, spatially recruited to HP1-rich nuclear regions, assumes a compact chromatin structure, and is physically associated with KAP1, HP1, and the H3 Lys 9-specific methyltransferase, SETDB1, over a highly localized region centered around the promoter. Remarkably, silencing established by a short pulse of hormone is stably maintained for >50 population doublings in the absence of hormone in clonal-cell populations, and the silent transgenes in these clones show promoter hypermethylation. Thus, like variegation in Drosophila, recruitment of mammalian HP1 to a euchromatic promoter can establish a silenced state that is epigenetically heritable.


Figures

Figure 1.
Figure 1.
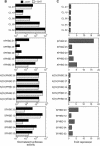
Characterization of chimeric transcriptional repressors. (A) Schematic illustration of repressor proteins. The KRAB, KRAB(DV), SNAG, Engrailed, BTB/POZ, and WT1 repression domains (RDs) were fused in frame with PAX3-HBD to generate the RD-PAX3-HBD fusion proteins. (B) Immunoprecipitation of transfected cell extracts with α-PAX3 IgG. Asterisks indicate the expressed proteins. MW, molecular weight markers. (C) 4-OHT-dependent repression of PAX3-luciferase reporter gene by the chimeric repressors. NIH3T3 cells were transfected with the indicated expression plasmids and the CD19-TK-LUC reporter plasmid. Post-transfection and 4-OHT treatment, cell lysates were assayed for luciferase and β-galactosidase activities. Fold repression represents the ratio of normalized luciferase activity of -/+OHT treated cells.
Figure 2A.
Figure 2A.
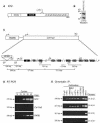
Characterization of stable cell lines. (A) Strategy to generate cell lines.
Figure 2B, C.
Figure 2B, C.
Characterization of stable cell lines. (B,C) 4-OHT-dependent repression of chromatinized PAX3-luciferase reporter gene in stable cell lines. First (top) graphs represent the normalized luciferase activity (B) and fold repression (C) of five independent “CL” (luciferase reporter) clones. Second, third, and fourth graphs illustrate the normalized luciferase activity (B) and fold repression (C) in clones stably expressing the respective RD-PAX3-HBD proteins.
Figure 2D.
Figure 2D.
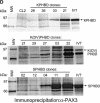
Characterization of stable cell lines. (D) Chimeric repressor protein expression in stable cell lines. Gels illustrate the protein expression in KPHBD (top), K(DV)PHBD (middle), and SPHBD (bottom) stable cell lines. Expression of full-length protein is indicated by in vitro-translated protein (IVT).
Figure 2E.
Figure 2E.
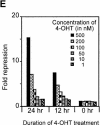
Characterization of stable cell lines. (E,F) Characterization of the KPHBD21 cell line. (E) Time- and 4-OHT-concentration-dependent repression. KPHBD21 cells were treated with vehicle or varying concentrations of 4-OHT for either 0, 12, or 24 h. Fold repression of luciferase activity was determined as above.
Figure 2F.
Figure 2F.
Characterization of stable cell lines. (E,F) Characterization of the KPHBD21 cell line. (F) 4-OHT-dependent transcriptional repression of luciferase gene. Oligo-dT primed first strand cDNAs from vehicle or 4-OHT-treated KPHBD21 cells were monitored for luciferase, neomycinR, and zeocinR transcripts by quantitative PCR. Arbitrary PhosphorImager units obtained from the Southern analysis are plotted. ▪, -OHT; •, +OHT.
Figure 3.
Figure 3.
Differential endonuclease accessibility observed only at the luciferase locus. (A) Restriction endonuclease sensitivity at the TK promoter-luciferase locus. Nuclei isolated from vehicle- (-OHT) or 4-OHT (+OHT)-treated KPHBD21 cells were treated with the indicated restriction endonucleases. Purified DNA was used in reiterative primer-extension PCR with LUC1 primer. The denatured products were resolved on Urea-PAGE and autoradiographed. (B,C) Restriction endonuclease sensitivity at the neomycinR (B) and zeocinR (C) loci monitored by using NEO2 and ZEO2 primers. MW, radiolabeled ϕX174 HaeIII digest; nt, nucleotide length; PAX3BS, PAX3-binding site.
Figure 4.
Figure 4.
KRAB-box-dependent recruitment of KAP1 and HP1 proteins to the integrated luciferase transgene. CL2 and KPHBD21 cells were treated with either vehicle (-OHT) or 4-OHT (+OHT), and the DNA-protein complexes were chemically cross-linked in vivo with formaldehyde. Soluble, sonicated chromatin was immunoprecipitated with α-PAX3, α-KAP1, α-HP1α, and α-HP1γ antibodies. Quantitative PCR was carried out with input and immunoprecipitated DNAs using specific primer pairs indicated in Figure 2A. PCR-amplified DNA fragments are depicted from ChIPs with α-PAX3, α-KAP1, α-HP1α, and α-HP1γ IgG. Bold vertical lines on the right indicate the relative positions of the transgene fragments amplified. The numbers in parentheses indicate fold enrichment, and NS denotes no signal.
Figure 5.
Figure 5.
NT2-KRAB zinc finger protein stably represses the expression of endogenous Col11a2 gene in NIH3T3 cells. (A) Diagrammatic representation of the mouse NT2-KRAB zinc finger protein. The positions of SCAN, KRAB domains, ZF motifs, and the antigen used for α-NT2 antibody production are indicated. (B) Abundant expression of NT2 protein in NIH3T3 cells. Nuclear proteins (100 μg) were electrophoresed on a 10% SDS-PAGE and immunoblotted with affinity-purified α-NT2 antibody. The ∼75 kD NT2 protein is indicated by an arrow and a nonspecific band is marked by an asterisk. (C) Genomic structure of RXRβ and Col11a2 genes. The Col11a2 gene is organized in a head-to-tail orientation with RXRβ. The relative locations of oligonucleotides used in ChIP-PCR experiments and the fragment sizes are indicated. E1 to E37 represent the exons of Col11a2 gene. (D) Expression patterns of NT2, Col11a2, and RXRβ transcripts in NIH3T3 cells. Oligo-dT-primed first-strand cDNAs were amplified by quantitative PCR using primer pairs specific for the NT2, Col11a2, and RXRβ transcripts and electrophoresed on 1.5% agarose gel. (E) Components of KRAB repression machinery are enriched at the silenced Col11a2 locus. Cross-linked chromatin was immunoprecipitated with the indicated antibodies and the bound DNA was analyzed by PCR using primers indicated in C.
Figure 6.
Figure 6.
4-OHT-dependent association of the luciferase transgene with condensed chromatin regions. The KPHBD21 cells were seeded onto glass coverslips and treated with either vehicle (-OHT) or 4-OHT (+OHT). FISH was carried out using luciferase probe and the nuclear DNA was visualized by staining with either DAPI (A) or Hoechst (B). The number of cells analyzed for each condition is indicated (C). The results are presented as the percent of FISH signals that were either associated (whitish green dots) or not associated (green dots) with the DAPI- or Hoechst-stained spots.
Figure 7.
Figure 7.
The KPHBD protein induces stable repression of the luciferase transgene. (A) Transient 4-OHT treatment of KPHBD21 cells induces a stable silencing component. Duplicate dishes of KPHBD21 cells were treated with either vehicle or 4-OHT (+OHT) continuously for 24 or 48 h and washings performed. Pairs of dishes (-/+OHT) were harvested at the indicated time points post 4-OHT removal and fold repression was determined. Filled bars, 24-h 4-OHT treatment; patterned bars, 48-h 4-OHT treatment. (B) A longer 4-OHT treatment of KPHBD21 cells can lead to a larger stable silencing component. Duplicate dishes of KPHBD21 cells were treated with either vehicle or 4-OHT continuously for 2, 4, or 6 d. Washings and replatings were performed as described in Materials and Methods. Pairs of dishes (-/+OHT) were harvested every day and fold repression was determined. ♦, 2 d of 4-OHT treatment; •, 4 d of 4-OHT treatment; ▪, 6 d of 4-OHT treatment. (C) 4-OHT-induced repression is not observed in K(DV)PHBD clones. The K(DV)PHBD3 (○) and K(DV)PHBD22 (•) clonal cell lines were treated with vehicle or 4-OHT continuously for 4 d, washed extensively, and fold repression determined. (D) 4-OHT-induced silencing component is not observed in SPHBD clones. The SPHBD11 (•) and SPHBD20 (○) clonal cell lines were treated with vehicle or 4-OHT continuously for 4 d, washed extensively, and fold repression determined.
Figure 8.
Figure 8.
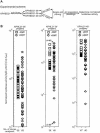
Clonal analysis of luciferase gene expression in KPHBD21 cells. (A) An experimental scheme designed to measure variegated expression of the luciferase gene in KPHBD21 cells. (B) Normalized luciferase activities for single cell progeny derived from KPHBD21-8, KPHBD21-39, or KPHBD21-49. Each □ and ⋄ represents an independent single-cell subclone of the parental line treated with either vehicle (-OHT) or 4-OHT (+OHT), respectively. The total number of single-cell subclones analyzed for each parental line is indicated at the bottom. Arrows denote the silent (cl 39-40) and active (cl 39-45) clones studied in detail.
Figure 9A, B, C, D.
Figure 9A, B, C, D.
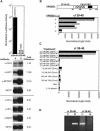
Molecular characteristics of the active and silent clones. (A) Prior to ChIP experiments, the silent (cl 39-40) and active (cl 39-45) clones were tested for their basal luciferase activities (top panel). Next, the cross-linked chromatin fractions obtained from silent (cl 39-40) and active (cl 39-45) clones were used in ChIPs with anti-PAX3, KAP1, SETDB1, HP1α, HP1γ, and MeK9 antibodies. The input and the immunoprecipitated DNAs were amplified using TKP1 and LUC1 primers (Fig. 2A). Fold difference was determined by PhosphorImager analysis of the Southern blots (bottom panel). (B) Indicated concentrations of VPDBD plasmid was transiently transfected into the silent clone (cl 39-40), the cell lysates were assayed for luciferase activities and normalized with β-galactosidase values. The filled and patterned bars represent results obtained from two independent experiments. (C) The silent (cl 39-40) and active (cl 39-45) clones were plated in multiple dishes and treated with the indicated chemicals for specified durations. The filled and patterned bars represent the luciferase activity obtained from duplicate dishes. (D) MSPCR. Genomic DNAs extracted from the silent (cl 39-40) and active (cl 39-45) clones were treated with sodium bisulfite and amplified using unmethylated sense (US) or methylated sense (MS) primers and an antisense primer (UMA1) belonging to the TK promoter indicated in E and shown.
Figure 9E.
Figure 9E.
Molecular characteristics of the active and silent clones. (E) Sodium bisulfite-genomic sequencing. The bisulfite-modified genomic DNAs of the silent (cl 39-40) and active (cl 39-45) clones were PCR-amplified using UMS1 (sense) and UMA1 (antisense) primers. The PCR products were TA-cloned into pCR II vector (Invitrogen). A representative selection of clones from both cl 39-40 and cl 39-45 were sequenced and the results presented. Hanging ⋄, the positions of CpG residues; □, the unmethylated CpG; ▪, methylated CpG residues. Arrows pointing up mark the CpG residues that are preferentially methylated in the genomic clones of cl 39-40.

Comment in

Similar articles

Cited by

References

    1. Abrink M., Ortiz, J.A., Mark, C., Sanchez, C., Looman, C., Hellman, L., Chambon, P., and Losson, R. 2001. Conserved interaction between distinct Kruppel-associated box domains and the transcriptional intermediary factor 1 beta. Proc. Natl. Acad. Sci. 98: 1422-1426. - PMC - PubMed
    1. Ayyanathan K., Fredericks, W.J., Berking, C., Herlyn, M., Balakrishnan, C., Gunther, E., and Rauscher III, F.J. 2000. Hormone-dependent tumor regression in vivo by an inducible transcriptional repressor directed at the PAX3-FKHR oncogene. Cancer Res. 60: 5803-5814. - PubMed
    1. Baker W.K. 1968. Position-effect variegation. Adv. Genet. 14: 133-169. - PubMed
    1. Bannister A.J., Zegerman, P., Partridge, J.F., Miska, E.A., Thomas, J.O., Allshire, R.C., and Kouzarides, T. 2001. Selective recognition of methylated lysine 9 on histone H3 by the HP1 chromo domain. Nature 410: 120-124. - PubMed
    1. Cameron E.E., Bachman, K.E., Myohanen, S., Herman, J.G., and Baylin, S.B. 1999. Synergy of demethylation and histone deacetylase inhibition in the re-expression of genes silenced in cancer. Nat. Genet. 21: 103-107. - PubMed

Publication types

MeSH terms