

Insig-1 "brakes" lipogenesis in adipocytes and inhibits differentiation of preadipocytes
- PMID: 12869692
- PMCID: PMC170943
- DOI: 10.1073/pnas.1133426100
Insig-1 "brakes" lipogenesis in adipocytes and inhibits differentiation of preadipocytes
Abstract
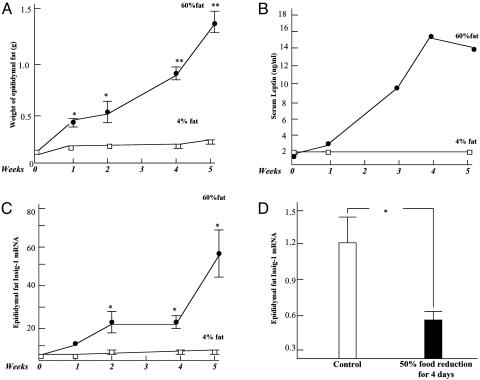
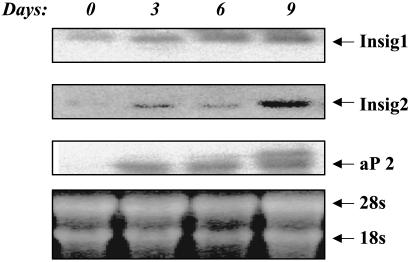
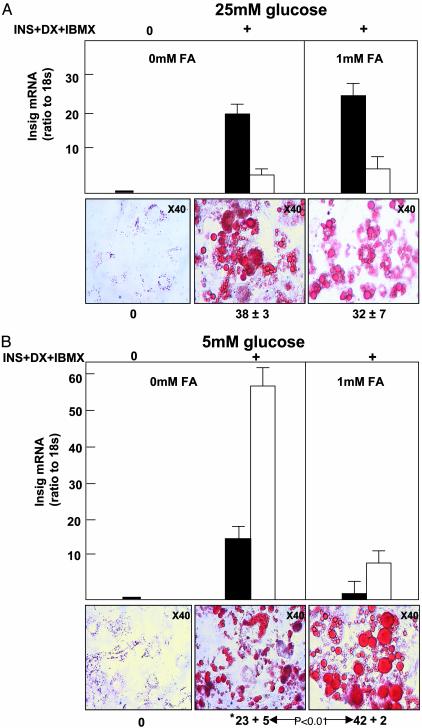
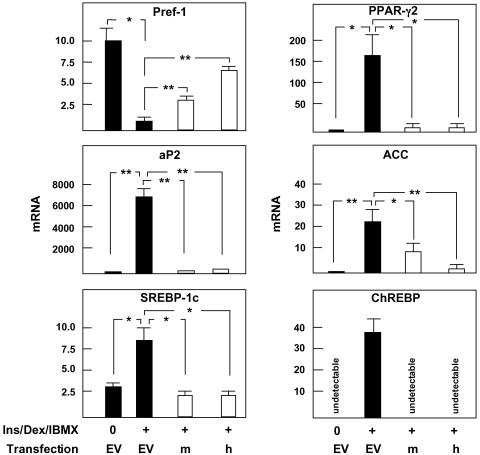
We have examined gene expression in the fat tissue of normal mice at the onset of diet-induced obesity. Insulin-induced gene 1 (insig-1) mRNA rose progressively with a high-fat diet and declined on a restricted diet. Because insig-1 binds sterol regulatory element-binding protein cleavage-activating protein in the endoplasmic reticulum, thereby blocking proteolytic processing required for sterol regulatory element-binding protein activation, we tested its influence on lipogenesis. In differentiating 3T3-L1 cells, insig-1 and -2 rose in parallel with aP2 mRNA during differentiation. The mRNA of the lipogenic transcription factor, carbohydrate response element-binding protein, was undetectable in undifferentiated 3T3-L1 preadipocytes but rose dramatically during differentiation in 25 mM, but not in 5 mM, glucose. Transfection of mouse or human insig-1 into 3T3-L1 preadipocytes completely prevented oil red O staining and blocked upregulation of aP2, peroxisome proliferator-activated receptor gamma2, and carbohydrate response element-binding protein, while reducing down-regulation of preadipocyte factor 1. The results suggest that insig-1 expression restricts lipogenesis in mature adipocytes and blocks differentiation in preadipocytes.
Figures
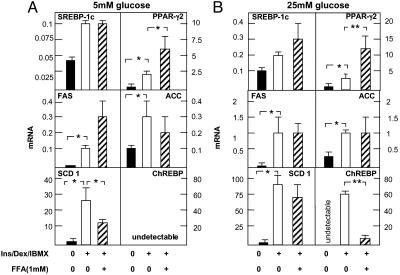
 , cells cultured in Ins/Dex/IBMX with added oleate/palmitate
(2:1). Data are mean ± SEM of the relative amount of mRNA of interest
calculated with 18S as standard. *, P < 0.05; **, P <
0.01 (n = 3). FAS, fatty acid synthase. ACC, acetyl CoA
carboxylase.
, cells cultured in Ins/Dex/IBMX with added oleate/palmitate
(2:1). Data are mean ± SEM of the relative amount of mRNA of interest
calculated with 18S as standard. *, P < 0.05; **, P <
0.01 (n = 3). FAS, fatty acid synthase. ACC, acetyl CoA
carboxylase.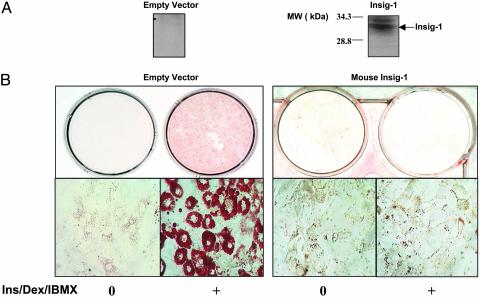
References
-
- Li, J., Yu, X., Pan, W. & Unger, R. H. (2002) Am. J. Physiol. 282, E1334-E1341. - PubMed
-
- Peng, Y., Schwarz, E. J., Lazar, M. A., Genin, A., Spinner, N. B. & Taub, R. (1997) Genomics 43, 278-284. - PubMed
-
- Yang, T., Espenshade, P. J., Wright, M. E., Yabe, D., Gong, Y., Aebersold, R., Goldstein, J. L. & Brown, M. S. (2002) Cell 110, 489-500. - PubMed
Publication types
MeSH terms
Substances
Grants and funding
LinkOut - more resources
Full Text Sources
Other Literature Sources
Molecular Biology Databases
Research Materials
