

Review
doi: 10.1261/rna.5680603.
Ribozyme speed limits
Affiliations
- PMID: 12869701
- PMCID: PMC1370456
- DOI: 10.1261/rna.5680603
Item in Clipboard
Review
Ribozyme speed limits
RNA.
2003 Aug.
Abstract
The speed at which RNA molecules decompose is a critical determinant of many biological processes, including those directly involved in the storage and expression of genetic information. One mechanism for RNA cleavage involves internal phosphoester transfer, wherein the 2'-oxygen atom carries out an SN2-like nucleophilic attack on the adjacent phosphorus center (transesterification). In this article, we discuss fundamental principles of RNA transesterification and define a conceptual framework that can be used to assess the catalytic power of enzymes that cleave RNA. We deduce that certain ribozymes and deoxyribozymes, like their protein enzyme counterparts, can bring about enormous rate enhancements.
Figures
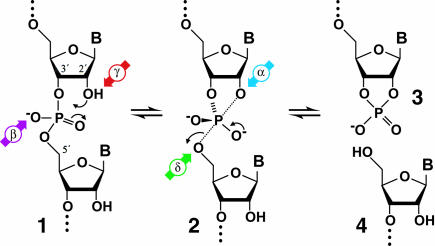
Mechanism for RNA cleavage by internal phosphoester transfer involving the 2′-hydroxyl group. The RNA linkage (1) passes through a pentacoordinate species (2) that degrades into fragments that carry either a 2′,3′-cyclic phosphate terminus (3) or a 5′-hydroxyl terminus (4). The four catalytic strategies that can influence the reaction are identified as follows: α, in-line nucleophilic attack (blue); β, neutralization of negative charge on a nonbridging phosphate oxygen (purple); γ, deprotonation of the 2′-hydroxyl group (red); and δ, neutralization of negative charge on the 5′-oxygen atom (green).
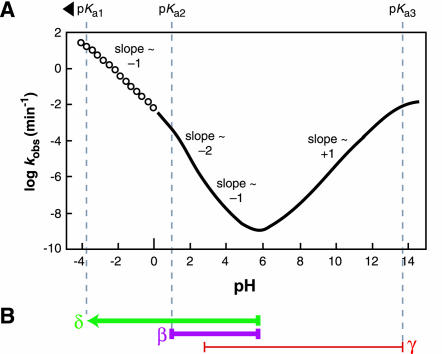
Dependence of RNA transesterification on specific acid and specific base catalysis. (A) Plot of the logarithm of the rate constant (predicted, see Materials and Methods) for cleavage versus pH at room temperature. Solid line indicates the region of the curve for which measured data exists for comparison value (Järvinen et al. 1991; Li and Breaker 1999). Open points indicate the region of the curve that is extrapolated based on the assumption that the pKa of the bridging 5′ oxygen is less than zero (~−3.5) and that no other rate-determining protonations occur below pH 0. The overall shape and slope of the curve match the previously reported data collected at 90°C (Järvinen et al. 1991). (B) Interpretation of the slope transitions of the curve depicted in A. The pH range over which the rate constant is dependent on protonations (β and δ) are shown with thick purple and green lines, respectively. The pH range in which the rate constant is affected by a deprotonation (γ) is shown with a thin red line. Measurements at 90°C show that the region between approximately pH 3 and 5 appears to have a slope of −1, which we interpret as reflecting two rate-determining protonations and one rate-determining deprotonation (see text).
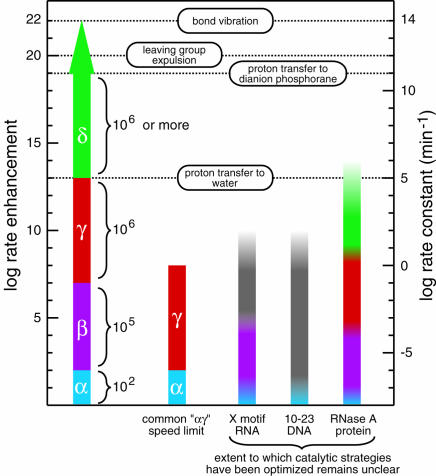
Magnitudes of rate enhancement for the four catalytic strategies. The individual and cumulative rate enhancements derived from enzymes perfecting each catalytic strategy are shown (left scale) from a baseline rate constant value of 10−8 min−1 (right scale) for the rate constant of RNA cleavage at neutral pH and 23°C without divalent metals (Li and Breaker 1999). The rate enhancement for perfect utilization of a combined αγ strategy, a commonly encountered speed limit of engineered ribozymes and deoxyribozymes (Breaker et al. 2003), is depicted next to the putative catalytic strategies used by several nucleic acid and protein enzymes. Open-top columns denote the fact that the highest rate constants measured for these enzymes do not reflect the rate constant of the chemical step. The X-motif RNA and 10–23 DNA columns are colored to reflect possible explanations for their rate enhancement, but structures and catalytic mechanism have not been definitively solved for either enzyme. The graded coloring is used to note the fact that it is not evident that the enzymes use the various catalytic strategies to their fullest extent. First-order rate constants of bond vibration and proton transfer from imidazolium ion to water were taken from Fersht (1999). Those of proton transfer to, and leaving group expulsion from, the dianion phosphorane intervening species of phosphoester transfer were taken from Perreault and Anslyn (1997).
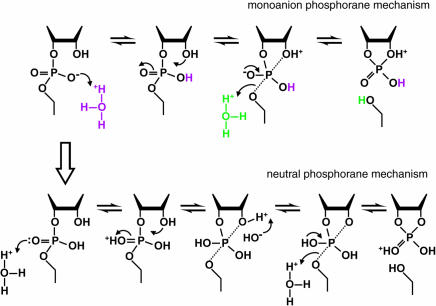
Mechanism of RNA cleavage at low pH. In the range of pH 1 to 2, the rate constant for RNA cleavage is dependent on two protonations. These may represent specific acid β (purple) and δ (green) catalysis (upper pathway; monoanion phosphorane mechanism) or specific acid β catalysis with another protonation at the second NBPO (lower pathway; neutral phosphorane mechanism). Only the chemical structure of the RNA linkage that is directly involved in the transformation is depicted. The apical bonds to the pentacoordinated phosphorous in the trigonal, bipyramidal structure are indicated with dotted lines. Deprotonation of the 2′-oxygen nucleophile would be required in the lower pathway to prevent it from departing more readily than the 5′-oxygen atom. The upper and lower pathways will be kinetically indistinguishable if deprotonation of the 2′ oxygen in the neutral phosphorane is more rapid than cleavage of the P-O5′ bond, and protonation also occurs at the 5′ oxygen.
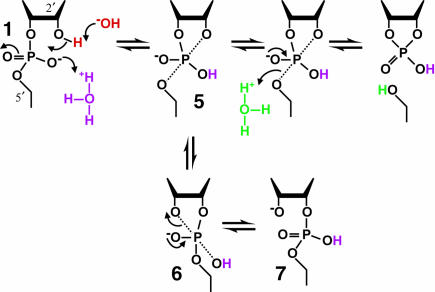
Mechanism of RNA cleavage under mildly acidic conditions. In the range of approximately pH 3 to 5, specific acid and base produce β (purple), γ (red), and δ (green) catalysis. β Catalysis by specific acid changes the nature of the reaction pathway by allowing 5 to exist as an intermediate long enough to allow pseudorotation to 6. This in turn allows departure of the 3′ oxygen to form a 2′,5′-phosphodiester linkage, 7. Other notations as in the legend of Figure 4 ▶.
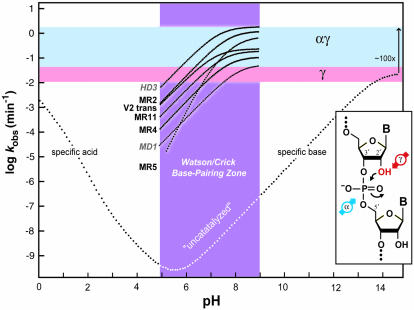
Engineered ribozymes that appear to maximize two catalytic strategies. The composite plot depicts the kinetic behavior of seven RNA-cleaving ribozymes (black text) and deoxyribozymes (gray, italics text) compared with the profile expected for the spontaneous cleavage of RNA (see Fig. 2A ▶). The pH range from 5 to 9 (purple) is expected to permit Watson/Crick pairing without pH-induced disruption. The range for the maximum rate constants for γ catalysis (pink), and for the combination of α and γ catalysis (light blue) are indicated. The pH profiles for the enzymes were derived from (Breaker et al. 2003). The distinct slope of the MR5 ribozyme could be explained by a combination of αγ catalysis and the need for a second deprotonation event to satisfy a structural requirement. (Inset) The α and γ catalytic strategies that, when used in combination, can explain the maximum rate constants and the kinetic profiles of the enzymes depicted.
References
-
- Adams, R.L.P., Knowler, J.T., and Leader, D.P. 1992. Degradation and modification of nucleic acids. In The biochemistry of the nucleic acids, 11th ed., pp. 97–133. Chapman & Hall, New York.
-
- Admiraal, S.J. and Herschlag, D. 1995. Mapping the transition state for ATP hydrolysis: Implications for enzymatic catalysis. Chem. Biol. 2: 729–739. - PubMed
-
- Almer, H. and Strömberg, R. 1996. Base catalysis and leaving group dependence in intramolecular alcoholysis of uridine 3′-(aryl phosphorothioate)s. J. Am. Chem. Soc. 118: 7921–7928.
-
- Bacher, J.E. and Kauzmann, W. 1952. The kinetics of hydrolysis of ribonucleic acid. J. Am. Chem. Soc. 74: 3779–3786.
-
- Benkovic, S.J. and Schray, K.J. 1970. Chemical basis of biological phosphoryl transfer. In The enzymes, 3rd ed., Vol. VIII (ed. P.D. Boyer), pp. 201–238, Academic Press, New York.
Publication types
MeSH terms
Substances
Grants and funding
LinkOut - more resources
Full Text Sources
Other Literature Sources