. 2003 Aug;9(8):958-69.
doi: 10.1261/rna.2116303.

Ribosomal localization of translation initiation factor IF2

Affiliations

Ribosomal localization of translation initiation factor IF2

Stefano Marzi et al. RNA. 2003 Aug.

Abstract

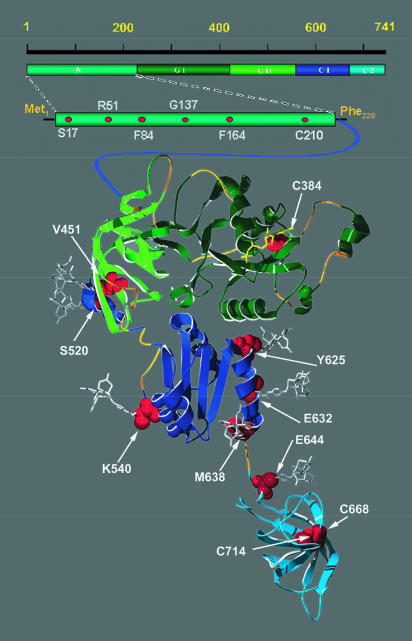
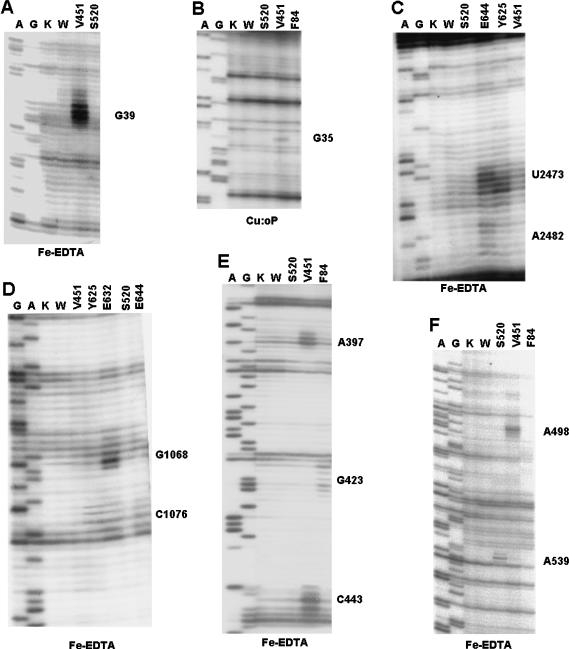
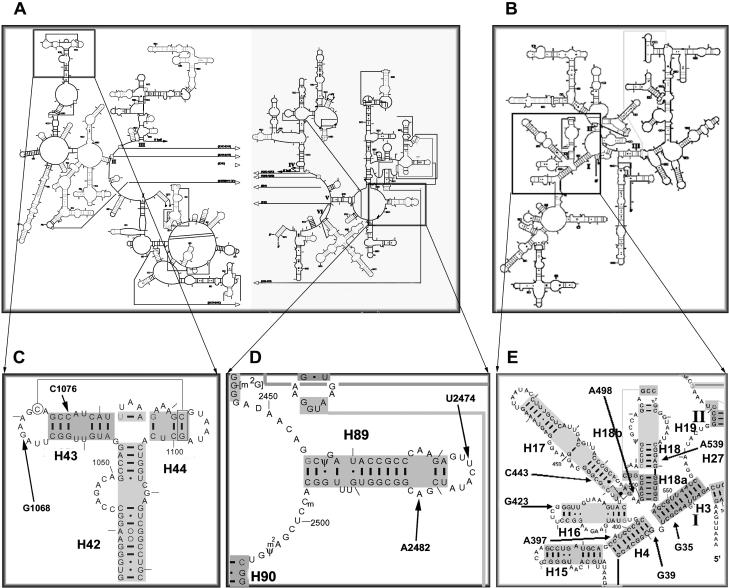
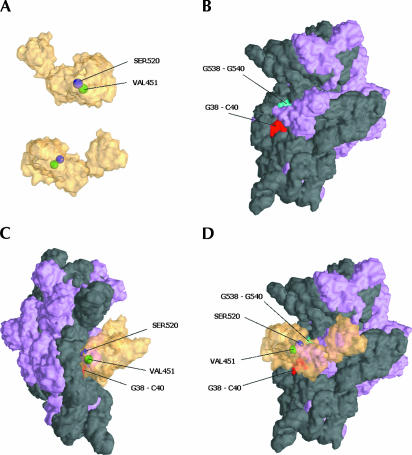
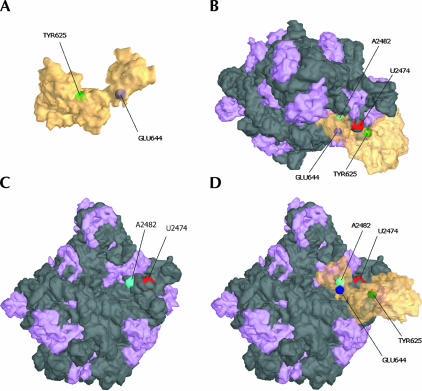
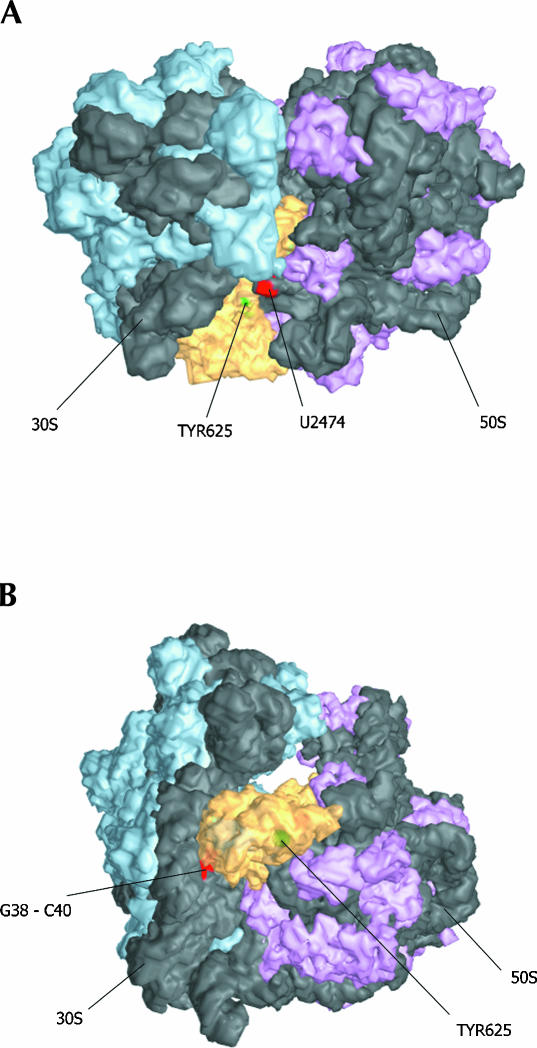
Bacterial translation initiation factor IF2 is a GTP-binding protein that catalyzes binding of initiator fMet-tRNA in the ribosomal P site. The topographical localization of IF2 on the ribosomal subunits, a prerequisite for understanding the mechanism of initiation complex formation, has remained elusive. Here, we present a model for the positioning of IF2 in the 70S initiation complex as determined by cleavage of rRNA by the chemical nucleases Cu(II):1,10-orthophenanthroline and Fe(II):EDTA tethered to cysteine residues introduced into IF2. Two specific amino acids in the GII domain of IF2 are in proximity to helices H3, H4, H17, and H18 of 16S rRNA. Furthermore, the junction of the C-1 and C-2 domains is in proximity to H89 and the thiostrepton region of 23S rRNA. The docking is further constrained by the requisite proximity of the C-2 domain with P-site-bound tRNA and by the conserved GI domain of the IF2 with the large subunit's factor-binding center. Comparison of our present findings with previous data further suggests that the IF2 orientation on the 30S subunit changes during the transition from the 30S to 70S initiation complex.


Figures

FIGURE 1.
FIGURE 1.
Domain structure of B. stearothermophilus IF2 displaying the location of the cysteine residues (natural and introduced by mutagenesis). The five domains of B. stearothermophilus IF2 are depicted schematically and color coded at the top of the figure. The three-dimensional structure of the protein as predicted by homology modeling (Guex and Peitsch 1997) with the archaeal IF2/eIF5B three-dimensional structure (Roll-Mecak et al. 2000) is presented at the bottom of the figure, following the same color scheme (the three-dimensional structure of the C-2 domain was taken from pdb file 1D1NA) (Guennegues et al. 2000). The regions of likely structural discrepancy between bacterial and archaeal proteins, according to the structural alignment and energy minimization, are shown in ochre. Bound GDP is shown in yellow. All Cys residues, including those naturally present in IF2 and those introduced by site-directed mutagenesis, are depicted as space-filled red residues within the three-dimensional structure model of IF2 and within the bar representing the amino-terminal portion of IF2.
FIGURE 2.
FIGURE 2.
Analysis of the cleavage sites in 16S and 23S rRNA produced by chemical nucleases tethered to IF2. Denaturing electrophoretic analysis of the primer extension products of the 16S (A,B,E,F) and 23S (C,D) rRNAs that were subjected to in situ cleavages by the IF2-tethered chemical nucleases Fe:EDTA (A,C,D–F) or Cu:oP (B). The nucleases were tethered to Cys residues naturally present or introduced by site-directed mutagenesis at the positions indicated at the tops of the lanes. (Lanes K,W) Control reaction mixtures that contained either nonderivatized wild-type IF2 (K) or the cleavage reaction carried out with derivatized wild-type IF2 (W). (Lanes A,G) Dideoxy sequencing lanes that refer to the sequence of 16S rRNA. The hydroxyl radical cleavages are seen as additional bands produced specifically by the chemical nucleases. See text for further details.
FIGURE 3.
FIGURE 3.
Secondary structure locations of cleavage sites produced by IF2-tethered chemical nucleases. The regions in which the IF2-tethered nucleases produce their cleavages are indicated on secondary structure maps of 23S (A,C,D) and 16S (B,E) rRNA. Cleavages were concentrated in the thiostrepton region (C) and H89 (D) of 23S, and in the 5′ domain (E) of 16S rRNA.
FIGURE 4.
FIGURE 4.
Location of cleavage sites on 16S rRNA superimposed on the three-dimensional structure of the 30S subunit. (A) Two views of IF2 (transparent yellow) with the derivatized amino acid positions S520 (purple) and V451 (green) that produced cleavage on the 16S rRNA are shown. (B) A surface representation of the interface side of the 30S subunit with rRNA shown in dark gray and ribosomal protein colored light purple (Carter et al. 2000). The major rRNA cleavage sites G38-C40 (red) and G538-G540 (green) are indicated. (C,D) Side and interface views of the 30S:IF2 docking.
FIGURE 5.
FIGURE 5.
Location of cleavage sites on 23S rRNA superimposed on the three-dimensional structure of the 50S subunit. (A) IF2 shown in transparent yellow with the locations of Y625 and E644 indicated in green and purple, respectively. (B, top) View of the 50S:IF2 complex. (C) A surface representation of the interface side of the 50S subunit with rRNA shown in dark gray and ribosomal protein colored light purple (Ban et al. 2000). The locations the landmark rRNA cleavage sites U2474 (red) and A2482 (green) are indicated. (D) Interface view of the 50S:IF2 interaction. Note that IF2 is transparent; amino acids shown are buried against the 50S interface.
FIGURE 6.
FIGURE 6.
Docking of IF2 on the 70S ribosome. (A) View from the top of the ribosome with several sites of cleavage indicated. Large subunit ribosomal protein density is colored purple, small subunit protein is shown in cyan; rRNA is dark gray. (B) View from the leading edge of the ribosome, facing the subunit interface. This 70S model was assembled from the 30S, 50S, and 70S crystal structures (Ban et al. 2000; Wimberly et al. 2000; Carter et al. 2001; Yusupov et al. 2001) as described in Materials and Methods.

References

    1. Abel, K., Yoder, M.D., Hilgenfeld, R., and Jurnak, F. 1996. An α to β conformational switch in EF-Tu. Structure 4: 1153–1159. - PubMed
    1. Ævarsson, A., Brazhnikov, E., Garber, M., Zheltonosova, J., Chirgadze, Y., al-Karadaghi, S., Svensson, L.A., and Liljas, A. 1994. Three-dimensional structure of the ribosomal translocase: Elongation factor G from Thermus thermophilus. EMBO J. 13: 3669–3677. - PMC - PubMed
    1. Agrawal, R.K., Penczek, P., Grassucci, R.A., and Frank, J. 1998. Visualization of elongation factor G on the Escherichia coli 70S ribosome: The mechanism of translocation. Proc. Natl. Acad. Sci. 95: 6134–6138. - PMC - PubMed
    1. Agrawal, R.K., Heagle, A.B., Penczek, P., Grassucci, R.A., and Frank, J. 1999. EF-G-dependent GTP hydrolysis induces translocation accompanied by large conformational changes in the 70S ribosome. Nat. Struct. Biol. 6: 643–647. - PubMed
    1. al-Karadaghi, S., Aevarsson, A., Garber, M., Zheltonosova, J., and Liljas, A. 1996. The structure of elongation factor G in complex with GDP: Conformational flexibility and nucleotide exchange. Structure 4: 555–565. - PubMed

Publication types

MeSH terms

LinkOut - more resources