. 2003 Jul 18:3:23.
doi: 10.1186/1471-2458-3-23.

Heterogeneity in regional notification patterns and its impact on aggregate national case notification data: the example of measles in Italy

Affiliations

Heterogeneity in regional notification patterns and its impact on aggregate national case notification data: the example of measles in Italy

John R Williams et al. BMC Public Health. .

Abstract

Background: A monthly time series of measles case notifications exists for Italy from 1949 onwards, although its usefulness is seriously undermined by extensive under-reporting which varies strikingly between regions, giving rise to the possibility of significant distortions in epidemic patterns seen in aggregated national data.

Results: A corrected national time series is calculated using an algorithm based upon the approximate equality between births and measles cases; under-reporting estimates are presented for each Italian region, and poor levels of reporting in Southern Italy are confirmed.

Conclusion: Although an order of magnitude larger, despite great heterogeneity between regions in under-reporting and in epidemic patterns, the shape of the corrected national time series remains close to that of the aggregated uncorrected data. This suggests such aggregate data may be quite robust to great heterogeneity in reporting and epidemic patterns at the regional level. The corrected data set maintains an epidemic pattern distinct from that of England and Wales.


Figures

Figure 1
Figure 1
Time series of Italian measles case notifications from 1888 to 1955.
Figure 2
Figure 2
Monthly measles case notifications for 1949–1996 standardised by regional mean. Regions are shown in customary geographic order, and data for each region are standardised by their mean. (NB as the city of Trieste was not incorporated into the region of Friuli Venezia Giulia until 1954, when the city's post-war status within Italy was finally resolved, two time series are shown for Friuli V. G.: up to 1954, and 1954 onwards)
Figure 3
Figure 3
Relationship between notified measles deaths and notified cases. Relationship between notified measles deaths and notified cases (unadjusted) for the Italian regions for the periods 1958–1967 (solid markers) and 1968–1977 (open markers) (only selected regions are labelled, with dotted lines joining corresponding data points for earlier and later periods). These are compared with the approximate range in the same relationship for England & Wales for the late 1940's and early 1950's (upper dashed line) and for the late 1950's to early 1960's (lower dashed line). Also shown (solid line) is an example of this relationship from a recent outbreak in a developing country (Peru) [16]
Figure 4
Figure 4
Estimated mean percentage of measles cases reported by region for the pre-vaccination period 1953–1976. The map also shows the conventional partition of Italy into North, Central and South (see Table 1).
Figure 5
Figure 5
Age distribution of measles cases in Italy for 1971–76. Age distribution of measles case reports for Italy for 1971–76 (thick solid line) is compared with age distribution of weights of 9-year moving average (thick dashed line), and those of the age distributions suggested by force of infection (FOI) estimates of Edmunds et al [15] made, respectively, from seroprevalence data (squares), case notifications (triangles) and that suggested by the composite 'EURO FOI' of those authors corresponding to a number of European countries (circles)
Figure 6
Figure 6
Adjusted and unadjusted measles notification data 1953–82. Comparison of (a) unadjusted national Italian measles notification data (thin line) and adjusted (dashed line) nationally aggregated regional notification data for the years 1953–82 and (b) the same data but with the uncorrected national data scaled to be of the same magnitude as that of the aggregate adjusted regional data (using the ratio of the means of the corrected and uncorrected data as the scaling factor).
Figure 7
Figure 7
Post-adjustment comparison of annual notification data for Italy and England & Wales. Comparison of Italian nationally aggregated regional yearly notification data (open and solid triangles) adjusted for under reporting with national data for England & Wales (aggregated prior to adjustment) (open circles). Adjustments are by moving average of births as described in the text (solid triangles) and by overall means of the moving averages (open triangles and circles).
Figure 8
Figure 8
Seasonal pattern for Italy of adjusted measles notification data. Monthly regional notification data for the period 1953–82 nationally aggregated after adjustment.
Figure 9
Figure 9
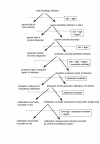
Illustration of some possible sources of error in case notification and of systematic bias (boxes). Figure assumes notification system based on case reports only, without laboratory confirmation of infection

References

    1. Anderson RM, May RM. Infectious diseases of humans: dynamics and control. Oxford, OUP; 1991.
    1. Salmaso S, Gabutti G, Rota MC, Giordano C, Penna C, Mandolini D, Crovari P. Pattern of susceptibility to measles in Italy. Bulletin of the World Health Organization. 2000;78:950–955. - PMC - PubMed
    1. Fine PEM, Clarkson JA. Measles in England and Wales: I, an analysis of factors underlying seasonal patterns. International Journal of Epidemiology. 1982;11:5–14. - PubMed
    1. Anderson RM, Grenfell BT, May RM. Oscillatory fluctuations in the incidence of infectious disease and the impact of vaccination: Time series analysis. Journal of Hygiene. 1984;93:587–608. - PMC - PubMed
    1. Grenfell BT, Anderson RM. The estimation of age-related rates of infection from case notifications and serological data. Journal of Hygiene (Cambridge) 1985;95:419–436. - PMC - PubMed

Publication types