

Differential binding of NAD+ and NADH allows the transcriptional corepressor carboxyl-terminal binding protein to serve as a metabolic sensor
- PMID: 12872005
- PMCID: PMC170896
- DOI: 10.1073/pnas.1633591100
Differential binding of NAD+ and NADH allows the transcriptional corepressor carboxyl-terminal binding protein to serve as a metabolic sensor
Abstract
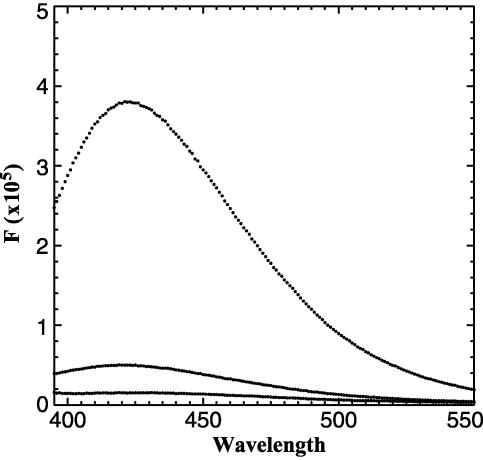
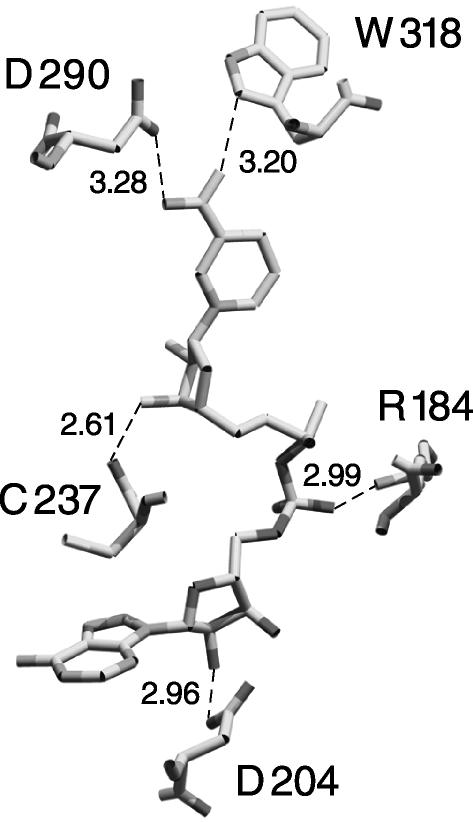
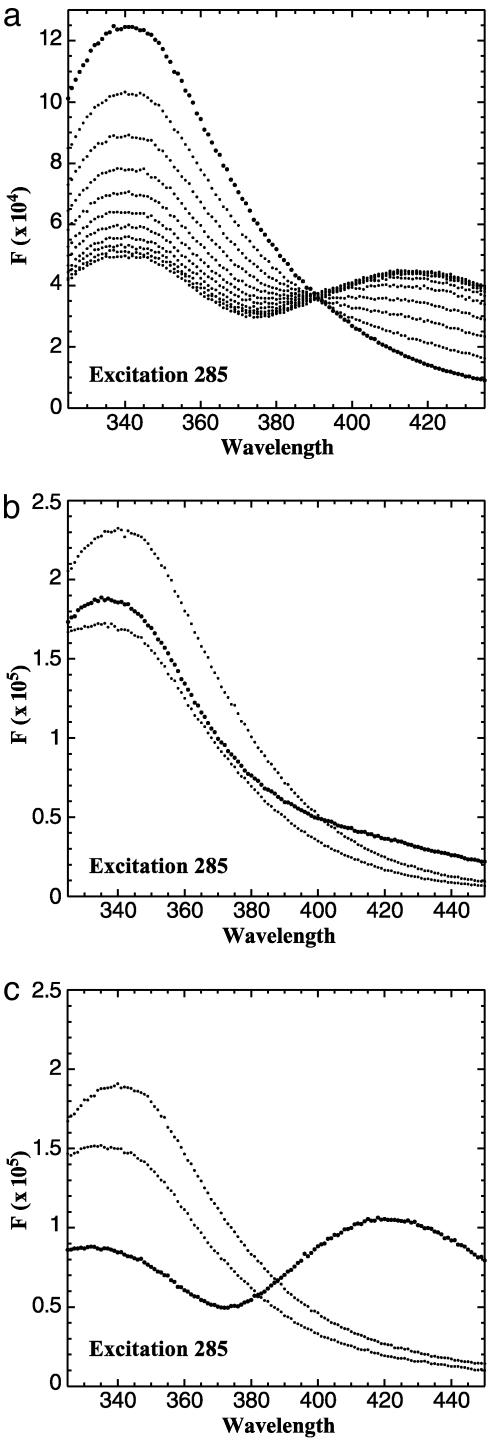
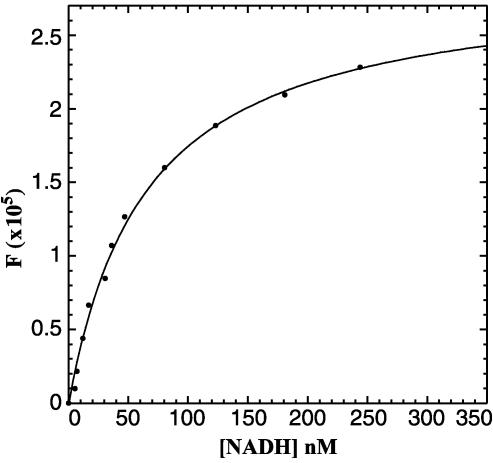
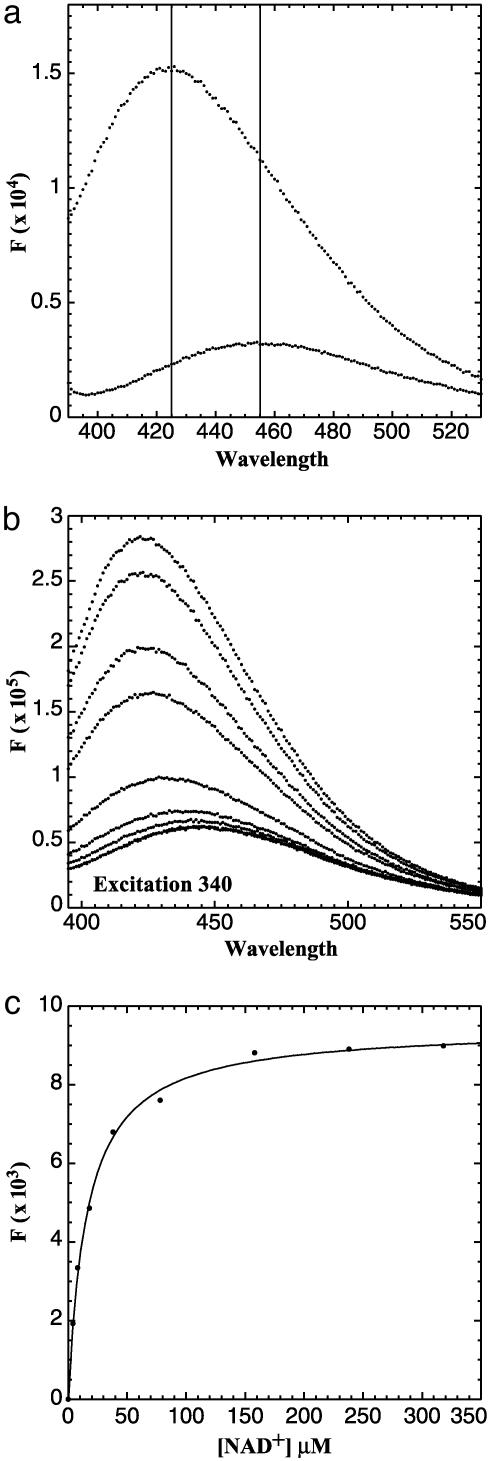
Carboxyl-terminal binding protein (CtBP) is a transcriptional corepressor originally identified through its ability to interact with adenovirus E1A. The finding that CtBP-E1A interactions were regulated by the nicotinamide adeninine dinucleotides NAD+ and NADH raised the possibility that CtBP could serve as a nuclear redox sensor. This model requires differential binding affinities of NAD+ and NADH, which has been controversial. The structure of CtBP determined by x-ray diffraction revealed a tryptophan residue adjacent to the proposed nicotinamide adenine dinucleotide binding site. We find that this tryptophan residue shows strong fluorescence resonance energy transfer to bound NADH. In this report, we take advantage of these findings to measure the dissociation constants for CtBP with NADH and NAD+. The affinity of NADH was determined by using fluorescence resonance energy transfer. The binding of NADH to protein is associated with an enhanced intensity of NADH fluorescence and a blue shift in its maximum. NAD+ affinity was estimated by measuring the loss of the fluorescence blue shift as NADH dissociates on addition of NAD+. Our studies show a >100-fold higher affinity of NADH than NAD+, consistent with the proposed function of CtBP as a nuclear redox sensor. Moreover, the concentrations of NADH and NAD+ required for half-maximal binding are approximately the same as their concentrations in the nuclear compartment. These findings support the possibility that changes in nuclear nicotinamide adenine dinucleotides could regulate the functions of CtBP in cell differentiation, development, or transformation.
Figures
Similar articles
-
Regulation of corepressor function by nuclear NADH.Science. 2002 Mar 8;295(5561):1895-7. doi: 10.1126/science.1069300. Epub 2002 Feb 14. Science. 2002. PMID: 11847309
-
Nicotinamide adenine dinucleotide stimulates oligomerization, interaction with adenovirus E1A and an intrinsic dehydrogenase activity of CtBP.FEBS Lett. 2003 Feb 27;537(1-3):157-60. doi: 10.1016/s0014-5793(03)00119-4. FEBS Lett. 2003. PMID: 12606049
-
Transcription corepressor CtBP is an NAD(+)-regulated dehydrogenase.Mol Cell. 2002 Oct;10(4):857-69. doi: 10.1016/s1097-2765(02)00650-0. Mol Cell. 2002. PMID: 12419229
-
Transcriptional regulation by C-terminal binding proteins.Int J Biochem Cell Biol. 2007;39(9):1593-607. doi: 10.1016/j.biocel.2007.01.025. Epub 2007 Feb 4. Int J Biochem Cell Biol. 2007. PMID: 17336131 Review.
-
C-terminal binding protein: A metabolic sensor implicated in regulating adipogenesis.Int J Biochem Cell Biol. 2011 May;43(5):693-6. doi: 10.1016/j.biocel.2011.01.017. Epub 2011 Jan 28. Int J Biochem Cell Biol. 2011. PMID: 21281737 Review.
Cited by
-
NAD captureSeq indicates NAD as a bacterial cap for a subset of regulatory RNAs.Nature. 2015 Mar 19;519(7543):374-7. doi: 10.1038/nature14020. Epub 2014 Dec 22. Nature. 2015. PMID: 25533955
-
NAD(+) Metabolism and the Control of Energy Homeostasis: A Balancing Act between Mitochondria and the Nucleus.Cell Metab. 2015 Jul 7;22(1):31-53. doi: 10.1016/j.cmet.2015.05.023. Epub 2015 Jun 25. Cell Metab. 2015. PMID: 26118927 Free PMC article. Review.
-
Metabolic Regulation of Lysine Acetylation: Implications in Cancer.Subcell Biochem. 2022;100:393-426. doi: 10.1007/978-3-031-07634-3_12. Subcell Biochem. 2022. PMID: 36301501 Review.
-
NAD(+)/NADH and skeletal muscle mitochondrial adaptations to exercise.Am J Physiol Endocrinol Metab. 2012 Aug 1;303(3):E308-21. doi: 10.1152/ajpendo.00054.2012. Epub 2012 Mar 20. Am J Physiol Endocrinol Metab. 2012. PMID: 22436696 Free PMC article. Review.
-
Label-free separation of human embryonic stem cells and their differentiating progenies by phasor fluorescence lifetime microscopy.J Biomed Opt. 2012 Apr;17(4):046012. doi: 10.1117/1.JBO.17.4.046012. J Biomed Opt. 2012. PMID: 22559690 Free PMC article.
References
Publication types
MeSH terms
Substances
LinkOut - more resources
Full Text Sources
Other Literature Sources
Molecular Biology Databases
