

Estimation of postsynaptic potentials in rat hypoglossal motoneurones: insights for human work
- PMID: 12872008
- PMCID: PMC2343211
- DOI: 10.1113/jphysiol.2003.044982
Estimation of postsynaptic potentials in rat hypoglossal motoneurones: insights for human work
Abstract
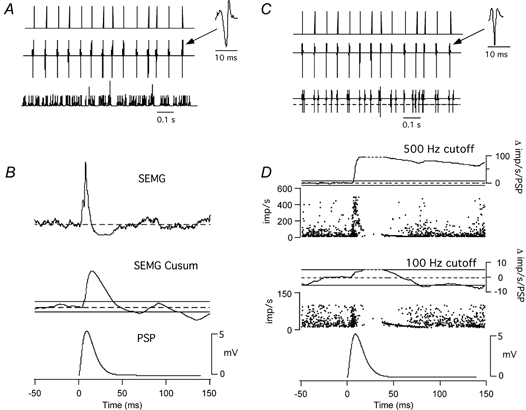
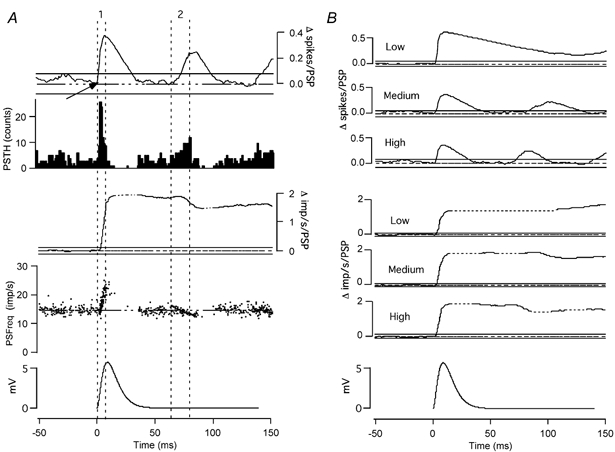
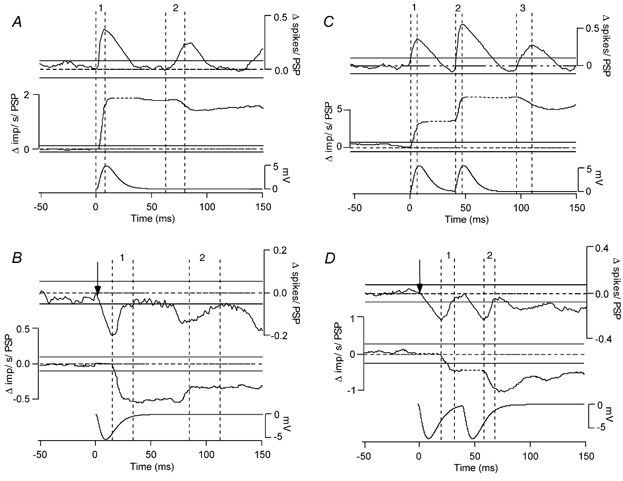
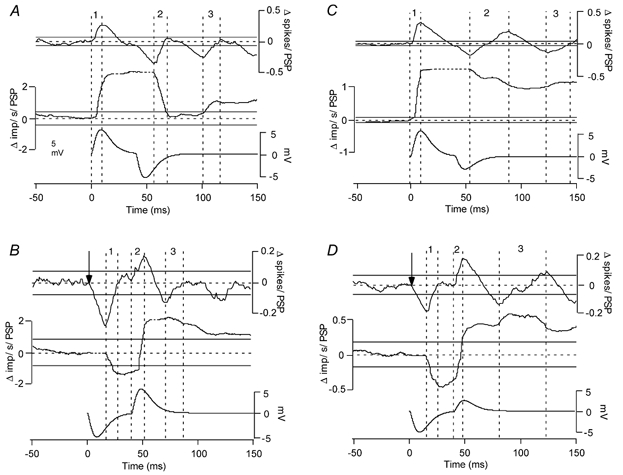
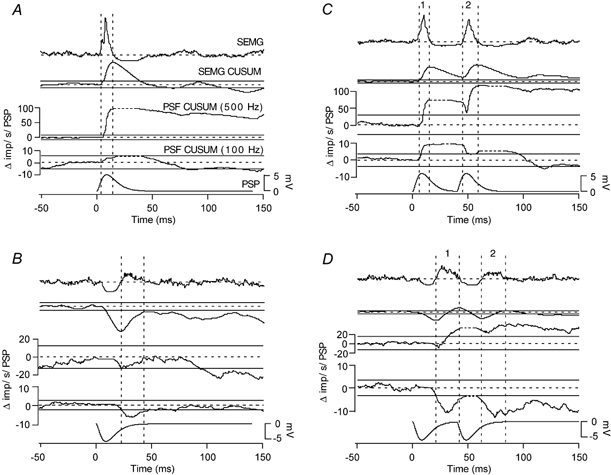
Classical techniques for estimating postsynaptic potentials in motoneurones include spike-triggered averages of rectified surface and multiunit electromyographic recordings (SEMG and MU-EMG), as well as the compilation of peristimulus time histograms (PSTH) based on the discharge of single motor units (SMU). These techniques rely on the probability of spike occurrence in relation to the stimulus and can be contaminated by count- and synchronization-related errors, arising from post-spike refractoriness and the discharge statistics of motoneurones. On the other hand, since these probability-based techniques are easy to use and require only inexpensive equipment, it is very likely that they will continue to be used in clinical and laboratory settings for the foreseeable future. One aim of the present study was to develop a modification of these probability-based analyses in order to provide a better estimate of the initial phase of postsynaptic potentials. An additional aim was to combine probability-based analyses with frequency-based analyses to provide a more reliable estimate of later phases of postsynaptic potentials. To achieve these aims, we have injected simple as well as complex current transients into regularly discharging hypoglossal motoneurones recorded in vitro from rat brainstem slices. We examined the discharge output of these cells using both probability- and frequency-based analyses to identify which of the two represented the profile of the postsynaptic potential more closely. This protocol was designed to obtain PSTHs of the responses of single motor units to repeated application of the same afferent input. We have also simulated multiunit responses to afferent input by replacing the times of spike occurrence in individual trials with a representation of either an intramuscular or surface-recording single motor unit waveform and summing many of these trials to obtain either a simulated SEMG or MU-EMG. We found that in a regularly discharging motoneurone, the rising phase of an EPSP moves the occurrence of spikes forward and hence induces a substantial peak in all probability-based records. This peak is followed immediately by a period of reduced activity ('silent period') due to the phase advancement of spikes that were to occur at this period. Similarly, the falling phase of an IPSP delays spikes so that they occur during the rising phase of the IPSP. During the delay, the probability-based analyses display gaps and during the occurrence of the delayed spikes they generate peaks. We found that all the probability-based analyses (SEMG, MU-EMG and PSTH) can be made useful for illustrating the underlying initial PSP by a special use of the cumulative sum (CUSUM) calculation. We have illustrated that, in most cases, the CUSUM of probability-based analyses can overcome the delay- or advance-related (i.e. the count-related) errors of the classical methods associated with the first PSP only. The probability-based records also induce secondary and tertiary peaks and troughs due to synchronization of the spikes in relation to the stimulus (i.e. the synchronization-related errors) by the first PSP to occur at fixed times from the stimulus. Special CUSUM analyses cannot overcome these synchronization-related errors. Frequency-based analysis (PSFreq) of individual and summed trials gave comparable and often better indications of the underlying PSPs than the probability-based analyses. When used in combination, these analyses compliment each other so that a more accurate estimation of the underlying PSP is possible. Since the correct identification of the connections in the central nervous system is of utmost importance in order to understand the operation of the system, we suggest that as well as the using the special CUSUM approach on probability-based records, researchers should seriously consider the use of frequency-based analyses in their indirect estimation of stimulus-induced compound synaptic potentials in human motoneurones.
Figures
Similar articles
-
Effects of large excitatory and inhibitory inputs on motoneuron discharge rate and probability.J Neurophysiol. 1999 Aug;82(2):829-40. doi: 10.1152/jn.1999.82.2.829. J Neurophysiol. 1999. PMID: 10444680
-
Functional identification of the input-output transforms of motoneurones in the rat and cat.J Physiol. 1997 Oct 15;504 ( Pt 2)(Pt 2):401-24. doi: 10.1111/j.1469-7793.1997.401be.x. J Physiol. 1997. PMID: 9365914 Free PMC article.
-
The effects of common input characteristics and discharge rate on synchronization in rat hypoglossal motoneurones.J Physiol. 2002 May 15;541(Pt 1):245-60. doi: 10.1113/jphysiol.2001.013097. J Physiol. 2002. PMID: 12015433 Free PMC article.
-
Studies of stimulus-evoked responses in single motoneurones in humans.J Physiol Paris. 1999 Jan-Apr;93(1-2):61-9. doi: 10.1016/s0928-4257(99)80136-3. J Physiol Paris. 1999. PMID: 10084709 Review.
-
Estimating post-synaptic potentials in tonically discharging human motoneurons.J Neurosci Methods. 1997 Jun 27;74(2):167-74. doi: 10.1016/s0165-0270(97)02247-4. J Neurosci Methods. 1997. PMID: 9219886 Review.
Cited by
-
Recovery of neuronal and network excitability after spinal cord injury and implications for spasticity.Front Integr Neurosci. 2014 May 12;8:36. doi: 10.3389/fnint.2014.00036. eCollection 2014. Front Integr Neurosci. 2014. PMID: 24860447 Free PMC article. Review.
-
Spinal inhibition and motor function in adults with spastic cerebral palsy.J Physiol. 2016 May 15;594(10):2691-705. doi: 10.1113/JP271886. Epub 2016 Mar 17. J Physiol. 2016. PMID: 26842905 Free PMC article.
-
Deciphering the contribution of intrinsic and synaptic currents to the effects of transient synaptic inputs on human motor unit discharge.Clin Neurophysiol. 2010 Oct;121(10):1643-54. doi: 10.1016/j.clinph.2009.10.041. Epub 2010 Apr 27. Clin Neurophysiol. 2010. PMID: 20427230 Free PMC article. Review.
-
A spinal pathway between synergists can modulate activity in human elbow flexor muscles.Exp Brain Res. 2008 Sep;190(3):347-59. doi: 10.1007/s00221-008-1479-5. Epub 2008 Jul 3. Exp Brain Res. 2008. PMID: 18597082 Free PMC article.
-
Mimicking human neuronal pathways in silico: an emergent model on the effective connectivity.J Comput Neurosci. 2014 Apr;36(2):235-57. doi: 10.1007/s10827-013-0467-3. Epub 2013 Jul 4. J Comput Neurosci. 2014. PMID: 23824758
References
-
- Burke D, Gandevia SC, McKeon B. Monosynaptic and oligosynaptic contributions to human ankle jerk and H-reflex. J Neurophysiol. 1984;52:435–448. - PubMed
Publication types
MeSH terms
Grants and funding
LinkOut - more resources
Full Text Sources
Research Materials
Miscellaneous