. 2003 Jul 21;198(2):223-33.
doi: 10.1084/jem.20021825.

Paired activating and inhibitory immunoglobulin-like receptors, MAIR-I and MAIR-II, regulate mast cell and macrophage activation

Affiliations

Paired activating and inhibitory immunoglobulin-like receptors, MAIR-I and MAIR-II, regulate mast cell and macrophage activation

Katsumi Yotsumoto et al. J Exp Med. .

Abstract

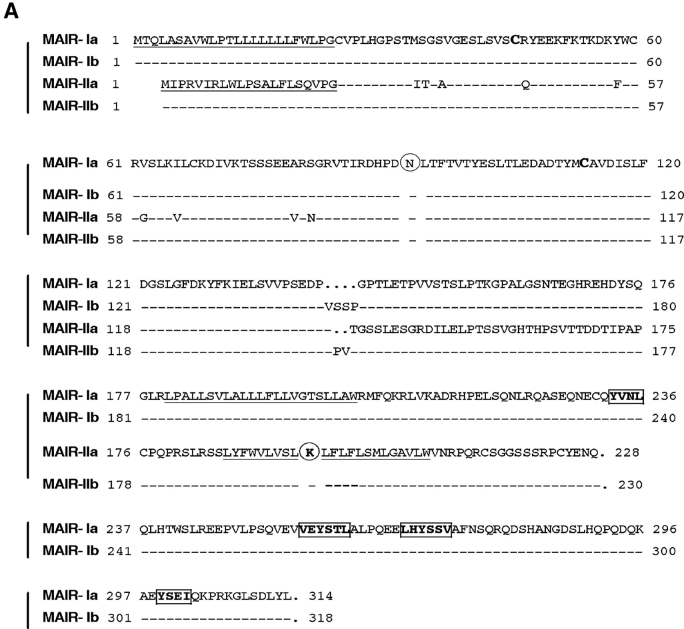
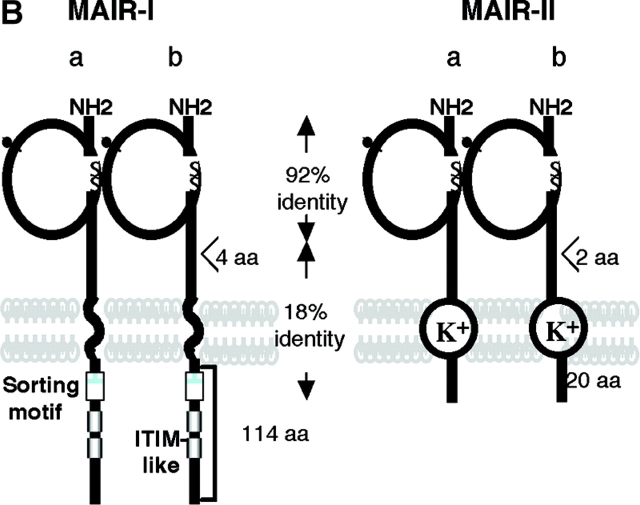
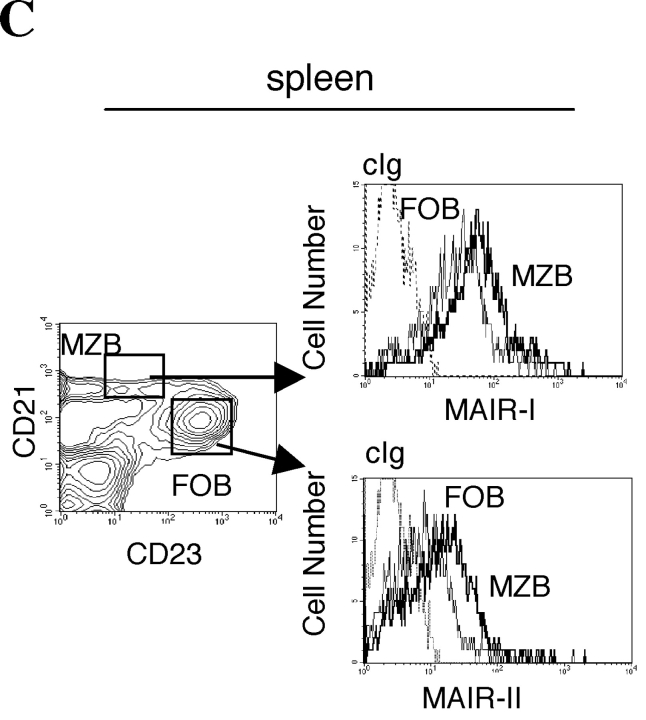
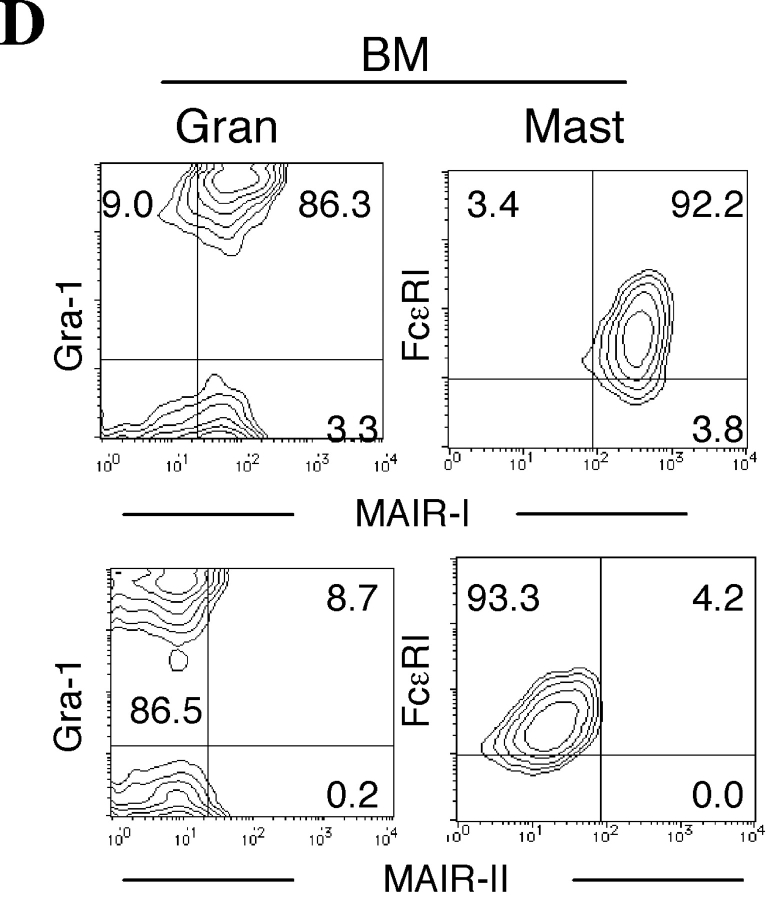
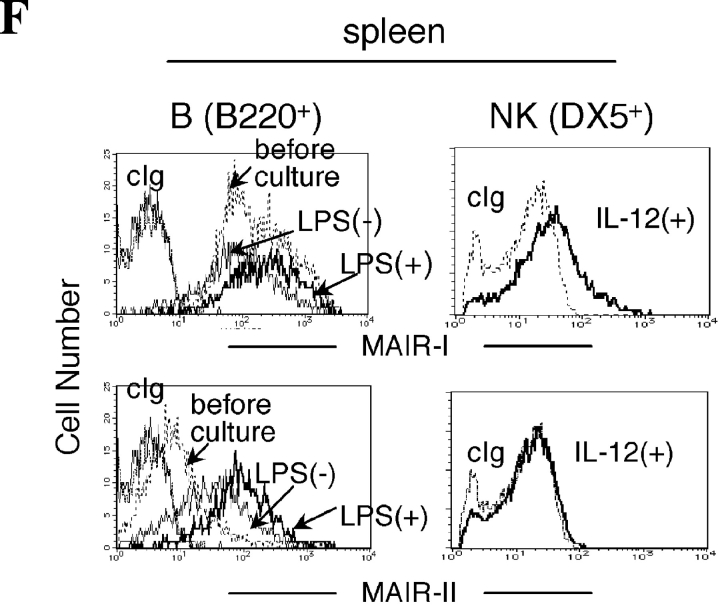
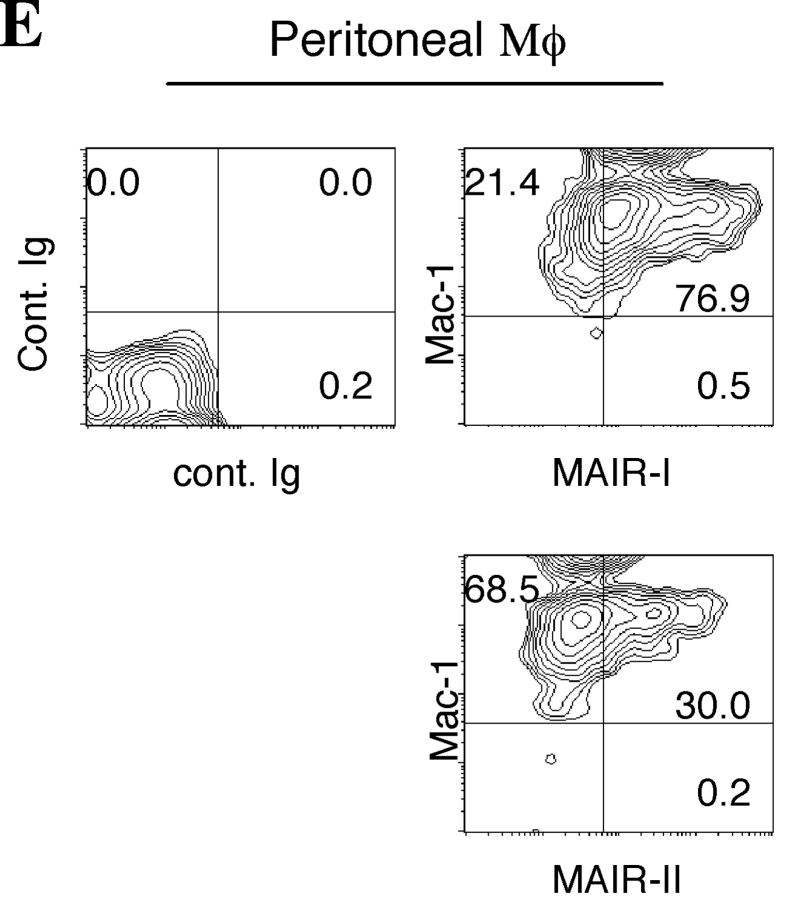
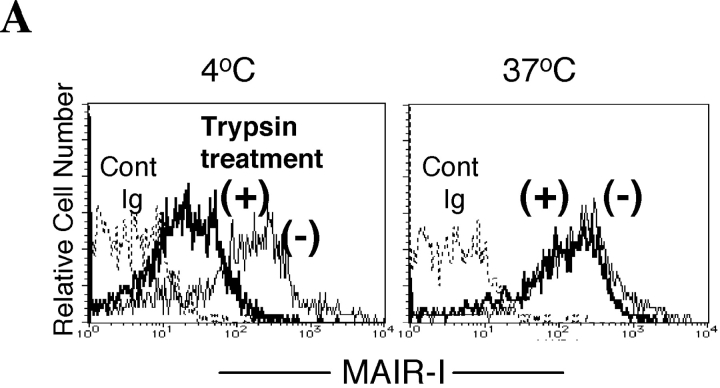
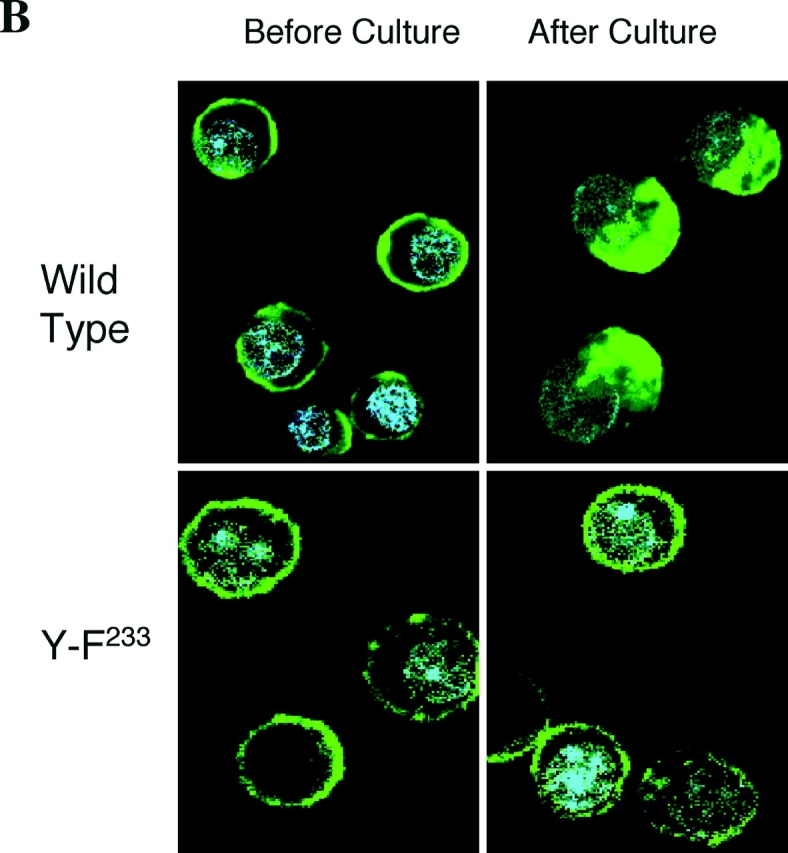
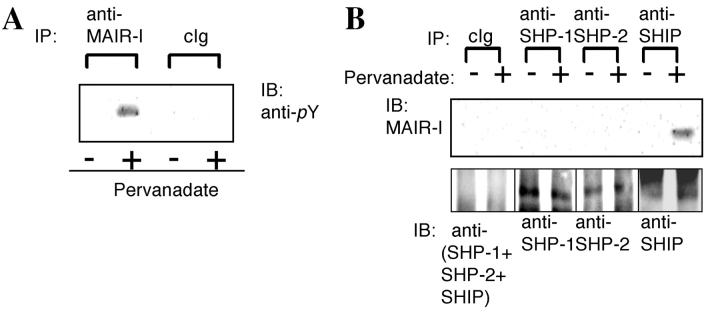
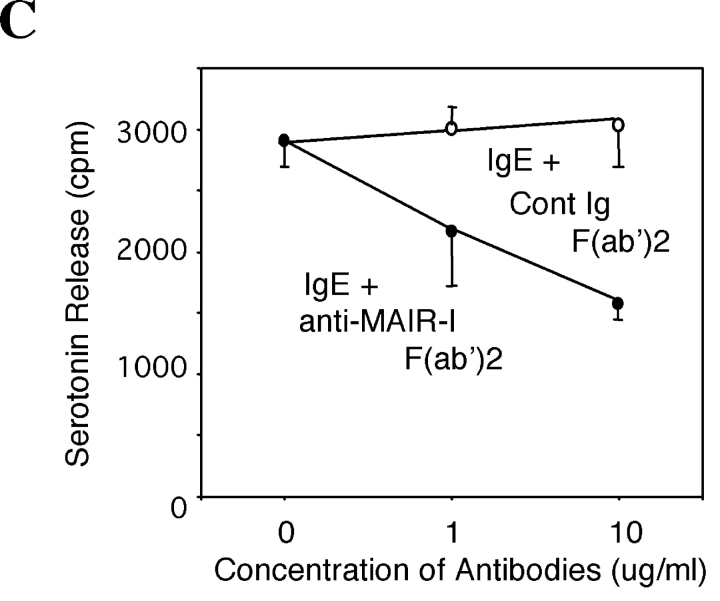
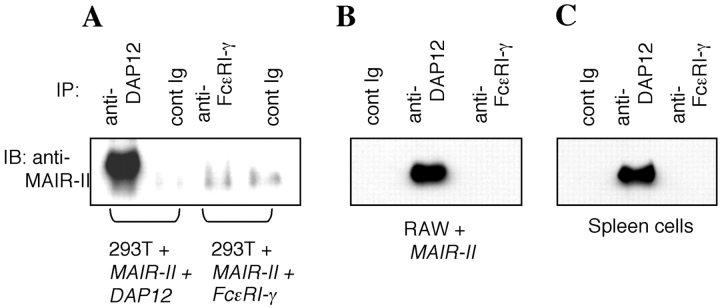
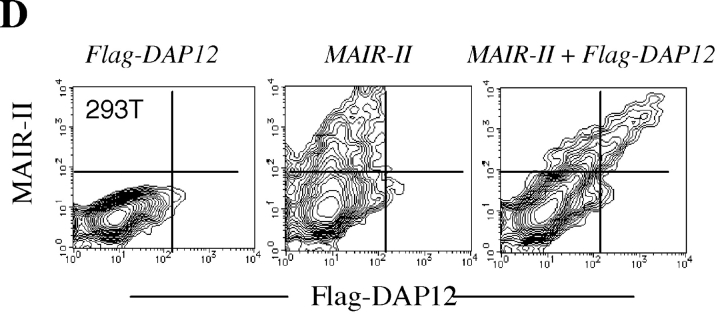
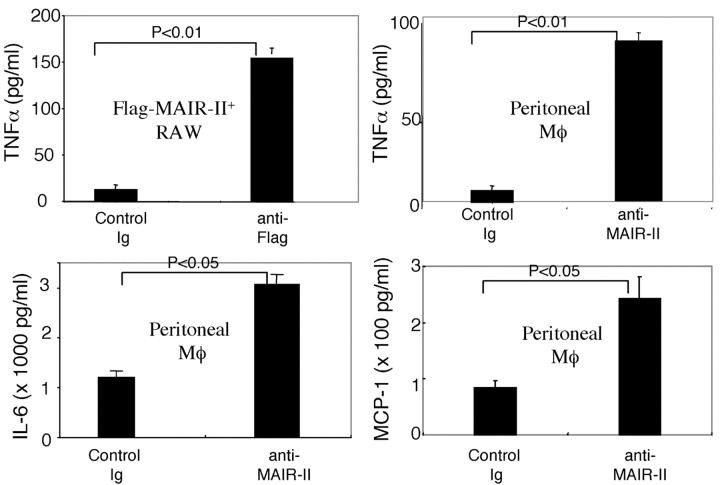
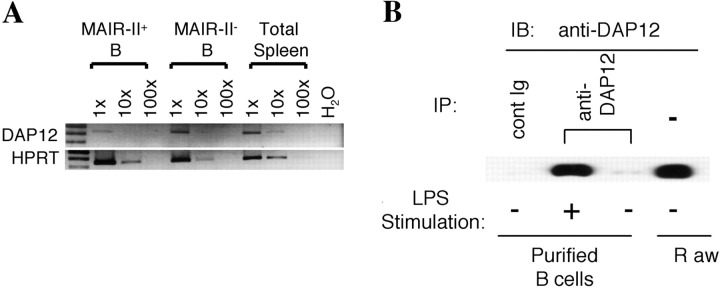
Immune responses are regulated by opposing positive and negative signals triggered by the interaction of activating and inhibitory cell surface receptors with their ligands. Here, we describe novel paired activating and inhibitory immunoglobulin-like receptors, designated myeloid-associated immunoglobulin-like receptor (MAIR) I and MAIR-II, whose extracellular domains are highly conserved by each other. MAIR-I, expressed on the majority of myeloid cells, including macrophages, granulocytes, mast cells, and dendritic cells, contains the tyrosine-based sorting motif and the immunoreceptor tyrosine-based inhibitory motif-like sequences in the cytoplasmic domain and mediates endocytosis of the receptor and inhibition of IgE-mediated degranulation from mast cells. On the other hand, MAIR-II, expressed on subsets of peritoneal macrophages and B cells, associates with the immunoreceptor tyrosine-based activation motif-bearing adaptor DAP12 and stimulates proinflammatory cytokines and chemokine secretions from macrophages. Thus, MAIR-I and MAIR-II play important regulatory roles in cell signaling and immune responses.


Figures

Figure 1.
Figure 1.
Molecular and biochemical characteristics of MAIR-I and MAIR-II. (A) Predicted aa sequences of MAIR-I and MAIR-II. The putative leader and transmembrane domain are underlined. Potential N-linked glycosylation sites in the extracellular domain and the charged aa residue in the transmembrane region are circled. Potential cysteine residues involved in disulfide bonding of the Ig-like domains are indicated in bold. ITIM-like or sorting motif in the cytoplasmic domain are boxed. The cDNA sequence data are available from GenBank/EMBL//DDBJ under accession nos. AB091765, AB091766, AB091767, and AB091768 (MAIR-Ia, MAIR-Ib, MAIR-IIa, and MAIR-IIb, respectively). (B) Schematic diagram of MAIR-I and MAIR-II proteins. A pair of cysteine residues in the extracellular portion potentially able to participate in intrachain disulfide bonding for the formation of Ig-like domains are indicated. (C) Southern blot analysis of genomic MAIR-I and MAIR-II. Mouse genomic DNA was digested with the indicated enzymes (E, EcoRI; B, BamHI; H, HindIII; X, XbaI; and P, PstI) and probed with the cDNA encoding the extracellular portion of MAIR-I. (D) BW5147 cells expressing the Flag-tagged MAIR-I or MAIR-II were lysed and proteins were analyzed by immunoblotting with anti-Flag mAb under reducing and nonreducing conditions. (E) BW5147 cells expressing the Flag-tagged MAIR-I or parental BW5147 cells were lysed and proteins were immunoprecipitated with anti-Flag. Precipitates were treated or not with N-glycosidase F and immunoblotted with anti-Flag mAb under nonreducing conditions.
Figure 1.
Figure 1.
Molecular and biochemical characteristics of MAIR-I and MAIR-II. (A) Predicted aa sequences of MAIR-I and MAIR-II. The putative leader and transmembrane domain are underlined. Potential N-linked glycosylation sites in the extracellular domain and the charged aa residue in the transmembrane region are circled. Potential cysteine residues involved in disulfide bonding of the Ig-like domains are indicated in bold. ITIM-like or sorting motif in the cytoplasmic domain are boxed. The cDNA sequence data are available from GenBank/EMBL//DDBJ under accession nos. AB091765, AB091766, AB091767, and AB091768 (MAIR-Ia, MAIR-Ib, MAIR-IIa, and MAIR-IIb, respectively). (B) Schematic diagram of MAIR-I and MAIR-II proteins. A pair of cysteine residues in the extracellular portion potentially able to participate in intrachain disulfide bonding for the formation of Ig-like domains are indicated. (C) Southern blot analysis of genomic MAIR-I and MAIR-II. Mouse genomic DNA was digested with the indicated enzymes (E, EcoRI; B, BamHI; H, HindIII; X, XbaI; and P, PstI) and probed with the cDNA encoding the extracellular portion of MAIR-I. (D) BW5147 cells expressing the Flag-tagged MAIR-I or MAIR-II were lysed and proteins were analyzed by immunoblotting with anti-Flag mAb under reducing and nonreducing conditions. (E) BW5147 cells expressing the Flag-tagged MAIR-I or parental BW5147 cells were lysed and proteins were immunoprecipitated with anti-Flag. Precipitates were treated or not with N-glycosidase F and immunoblotted with anti-Flag mAb under nonreducing conditions.
Figure 2.
Figure 2.
Expression of MAIR-I and MAIR-II transcripts. (A) Expression of MAIR-I and/or MAIR-II transcripts was analyzed by Northern blot analysis using cDNA encoding MAIR-I extracellular portion as a probe. The comparable amount of β-actin transcript expression in each lane using β-actin cDNA was confirmed (not depicted). (B) cDNA, adjusted to comparable quantities using a HPRT control, was prepared from purified cells by cell sorter, as indicated. These cDNA and water (used as a negative control) were used as templates for RT-PCR. PCR products were amplified using specific primers for MAIR-I and MAIR-II.
Figure 3.
Figure 3.
Cell surface expression of MAIR-I and MAIR-II proteins. (A) BW5147 transfectants expressing MAIR-I or MAIR-II were stained with control rat Ig or anti–MAIR-I (TX-8 mAb) or anti–MAIR-II (TX-13 mAb), followed by allophycocyanin-conjugated streptavidin. (B, D, and E) Spleen, bone marrow, or peritoneal macrophages from C57/BL6 mice were stained with either biotin-conjugated F(ab′)2 fragments of anti–MAIR-I or anti–MAIR-II and the PE-conjugated mAbs indicated, followed by allophycocyanin-conjugated streptavidin. Greater than 99% of cells stained with F(ab′)2 fragments of control Igs were present in the bottom left quadrant of the contour plots (B and D, and not depicted in C). (C) Spleen cells were stained with FITC-conjugated anti-CD21, PE-conjugated anti-CD23, and biotin-conjugated anti–MAIR-II monoclonal antibodies, followed by allophycocyanin-conjugated streptavidin. MAIR-I and MAIR-II expression on the CD21hiCD23lo (marginal zone B cells [MZB]) and CD21intCD23hi (follicular B cells [FOB]) cells were analyzed by flow cytometry. (E) B220+ B cells purified from splenocytes or total splenocytes were cultured for 48 h or not in the presence or absence of LPS or IL-12, as indicated, and stained with either biotin-conjugated F(ab′)2 fragments of control Ig, anti–MAIR-I or anti–MAIR-II and the FITC-conjugated B220 or DX5 mAb, followed by allophycocyanin-conjugated streptavidin. Cells were gated according to B220 or DX5 expressions and analyzed by flow cytometry. Data are representative in several independent experiments.
Figure 3.
Figure 3.
Cell surface expression of MAIR-I and MAIR-II proteins. (A) BW5147 transfectants expressing MAIR-I or MAIR-II were stained with control rat Ig or anti–MAIR-I (TX-8 mAb) or anti–MAIR-II (TX-13 mAb), followed by allophycocyanin-conjugated streptavidin. (B, D, and E) Spleen, bone marrow, or peritoneal macrophages from C57/BL6 mice were stained with either biotin-conjugated F(ab′)2 fragments of anti–MAIR-I or anti–MAIR-II and the PE-conjugated mAbs indicated, followed by allophycocyanin-conjugated streptavidin. Greater than 99% of cells stained with F(ab′)2 fragments of control Igs were present in the bottom left quadrant of the contour plots (B and D, and not depicted in C). (C) Spleen cells were stained with FITC-conjugated anti-CD21, PE-conjugated anti-CD23, and biotin-conjugated anti–MAIR-II monoclonal antibodies, followed by allophycocyanin-conjugated streptavidin. MAIR-I and MAIR-II expression on the CD21hiCD23lo (marginal zone B cells [MZB]) and CD21intCD23hi (follicular B cells [FOB]) cells were analyzed by flow cytometry. (E) B220+ B cells purified from splenocytes or total splenocytes were cultured for 48 h or not in the presence or absence of LPS or IL-12, as indicated, and stained with either biotin-conjugated F(ab′)2 fragments of control Ig, anti–MAIR-I or anti–MAIR-II and the FITC-conjugated B220 or DX5 mAb, followed by allophycocyanin-conjugated streptavidin. Cells were gated according to B220 or DX5 expressions and analyzed by flow cytometry. Data are representative in several independent experiments.
Figure 4.
Figure 4.
Internalization of MAIR-I. (A) Peritoneal macrophages were incubated with biotin-labeled anti–MAIR-I mAb (TX-8), followed by allophycocyanin-labeled streptavidin at 4 or 37°C for 30 min. The cells were treated (+) or not (−) with trypsin and analyzed by flow cytometry. (B) Ba/F3 transfectants expressing Flag-tagged wild-type and mutated MAIR-I were incubated with anti-Flag mAb, followed by cross-linking with FITC-labeled anti–mouse IgG secondary antibody at 4°C. Cells were incubated or not at 37°C for 30 min, fixed, mounted with VECTASHIELD including DAPI, and analyzed using a confocal scanning laser microscope. Data are representative in several independent experiments.
Figure 4.
Figure 4.
Internalization of MAIR-I. (A) Peritoneal macrophages were incubated with biotin-labeled anti–MAIR-I mAb (TX-8), followed by allophycocyanin-labeled streptavidin at 4 or 37°C for 30 min. The cells were treated (+) or not (−) with trypsin and analyzed by flow cytometry. (B) Ba/F3 transfectants expressing Flag-tagged wild-type and mutated MAIR-I were incubated with anti-Flag mAb, followed by cross-linking with FITC-labeled anti–mouse IgG secondary antibody at 4°C. Cells were incubated or not at 37°C for 30 min, fixed, mounted with VECTASHIELD including DAPI, and analyzed using a confocal scanning laser microscope. Data are representative in several independent experiments.
Figure 5.
Figure 5.
MAIR-I recruits the tyrosine phosphatase SHIP and inhibits serotonin release from mast cells. (A and B) Mast cells, derived from bone marrow cells after culture in the presence of IL-3 and stem cell factor (SCF), were stimulated or not with pervanadate for 10 min at 37°C and lysed in 1% NP-40 (A) or digitonin (B) buffer and immunoprecipitated with cIg, anti–MAIR-I, anti–SHP-I, anti–SHP-II, or anti-SHIP. The immunoprecipitates were immunoblotted with antiphosphotyrosine mAb (A) or anti–MAIR-I (B). (C) Mast cells were loaded with [3H]serotonin and stimulated with an IgE mAb plus either F(ab′)2 fragments of anti–MAIR-I or control rat IgG, followed by coligation with a common secondary reagent. [3H]Serotonin release into the supernatants was measured by a liquid scintillation counter. Data are representative in several independent experiments.
Figure 5.
Figure 5.
MAIR-I recruits the tyrosine phosphatase SHIP and inhibits serotonin release from mast cells. (A and B) Mast cells, derived from bone marrow cells after culture in the presence of IL-3 and stem cell factor (SCF), were stimulated or not with pervanadate for 10 min at 37°C and lysed in 1% NP-40 (A) or digitonin (B) buffer and immunoprecipitated with cIg, anti–MAIR-I, anti–SHP-I, anti–SHP-II, or anti-SHIP. The immunoprecipitates were immunoblotted with antiphosphotyrosine mAb (A) or anti–MAIR-I (B). (C) Mast cells were loaded with [3H]serotonin and stimulated with an IgE mAb plus either F(ab′)2 fragments of anti–MAIR-I or control rat IgG, followed by coligation with a common secondary reagent. [3H]Serotonin release into the supernatants was measured by a liquid scintillation counter. Data are representative in several independent experiments.
Figure 6.
Figure 6.
Physical association of MAIR-II with DAP12. (A–C) 293T and RAW cells, which were transfected with cDNA as indicated, and spleen cells after stimulation with LPS were lysed in digitonin buffer, immunoprecipitated with control Ig, anti-DAP12, or anti-FcɛRIγ, and immunoblotted with anti–MAIR-II (TX-10). (D) 293T cells were transfected with Flag-tagged DAP12, MAIR-II, or a combination of Flag-tagged DAP12 and MAIR-II, and stained with biotin-conjugated anti–MAIR-II and FITC-conjugated anti-Flag mAbs, followed by allophycocyanin-conjugated streptavidin. Cell surface expression of MAIR-II and DAP12 was analyzed by flow cytometry.
Figure 6.
Figure 6.
Physical association of MAIR-II with DAP12. (A–C) 293T and RAW cells, which were transfected with cDNA as indicated, and spleen cells after stimulation with LPS were lysed in digitonin buffer, immunoprecipitated with control Ig, anti-DAP12, or anti-FcɛRIγ, and immunoblotted with anti–MAIR-II (TX-10). (D) 293T cells were transfected with Flag-tagged DAP12, MAIR-II, or a combination of Flag-tagged DAP12 and MAIR-II, and stained with biotin-conjugated anti–MAIR-II and FITC-conjugated anti-Flag mAbs, followed by allophycocyanin-conjugated streptavidin. Cell surface expression of MAIR-II and DAP12 was analyzed by flow cytometry.
Figure 7.
Figure 7.
MAIR-II stimulates cytokines and chemokines secretion from macrophages. RAW cells transfected with Flag-tagged MAIR-II cDNA at the NH2 terminus and peritoneal macrophages were pretreated with anti-CD16/32 (Fcγ receptors) to block Fc binding of mAbs, stimulated with plastic-coated control Ig, anti-Flag, or anti–MAIR-II, and cultured for 48 h. Culture supernatants were harvested, and cytokine's and chemokine's concentrations were measured by ELISA.
Figure 8.
Figure 8.
Expression of DAP12 in B cells. (A) Spleen cells were stained with biotin-conjugated anti–MAIR-II and PE-conjugated B220, followed by allophycocyanin-conjugated streptavidin. MAIR-II+B220+ and MAIR-IIB220+ cells were purified by repeating sorting twice on flow cytometry (>99.8% purity). The RNA was extracted from the fractionated and total spleen cells and was subjected to semiquantitive RT-PCR (30 cycles) for DAP12 and HPRT, according to template dose by dilution. (B) B cells were purified from spleen cells by repeating positive selection twice with B220+ MACS-beads (>99.0% purity). 5 × 10⁶ purified B cells were stimulated or not with 10 μg/ml LPS for 24 h, lysed in 1% NP-40 lysis buffer, and immunoprecipitated with control Ig or anti-DAP12. Immunoprecipitates or lysates of 106 raw cells were immunoblotted with anti-DAP12.

References

    1. Ravetch, J.V., and L.L. Lanier. 2000. Immune inhibitory receptors. Science. 290:84–89. - PubMed
    1. Lanier, L.L. 2001. Face off–the interplay between activating and inhibitory immune receptors. Curr. Opin. Immunol. 13:326–331. - PubMed
    1. Malbec, O., D.C. Fong, M. Turner, V.L. Tybulewicz, J.C. Cambier, W.H. Fridman, and M. Daeron. 1998. Fc epsilon receptor I-associated lyn-dependent phosphorylation of Fc gamma receptor IIB during negative regulation of mast cell activation. J. Immunol. 160:1647–1658. - PubMed
    1. Smith, K.G., D.M. Tarlinton, G.M. Doody, M.L. Hibbs, and D.T. Fearon. 1998. Inhibition of the B cell by CD22: a requirement for Lyn. J. Exp. Med. 187:807–811. - PMC - PubMed
    1. Takai, T., and M. Ono. 2001. Activating and inhibitory nature of the murine paired immunoglobulin-like receptor family. Immunol. Rev. 181:215–222. - PubMed

Publication types

MeSH terms