. 2003 Jul 21;198(2):235-47.
doi: 10.1084/jem.20030422.

Direct expansion of functional CD25+ CD4+ regulatory T cells by antigen-processing dendritic cells

Affiliations

Direct expansion of functional CD25+ CD4+ regulatory T cells by antigen-processing dendritic cells

Sayuri Yamazaki et al. J Exp Med. .

Abstract

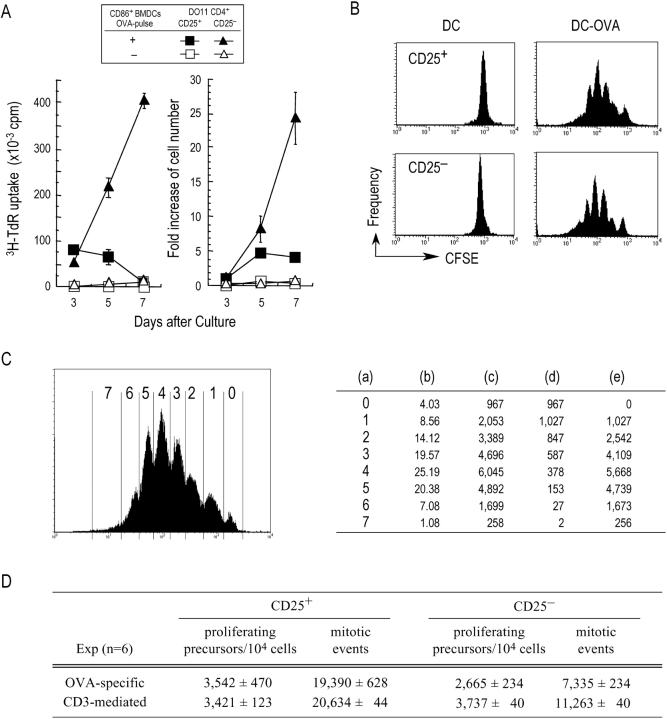
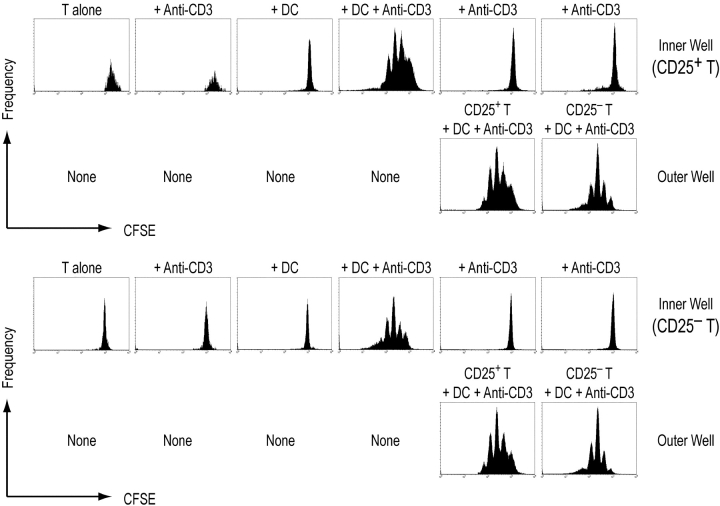
An important pathway for immune tolerance is provided by thymic-derived CD25+ CD4+ T cells that suppress other CD25- autoimmune disease-inducing T cells. The antigen-presenting cell (APC) requirements for the control of CD25+ CD4+ suppressor T cells remain to be identified, hampering their study in experimental and clinical situations. CD25+ CD4+ T cells are classically anergic, unable to proliferate in response to mitogenic antibodies to the T cell receptor complex. We now find that CD25+ CD4+ T cells can proliferate in the absence of added cytokines in culture and in vivo when stimulated by antigen-loaded dendritic cells (DCs), especially mature DCs. With high doses of DCs in culture, CD25+ CD4+ and CD25- CD4+ populations initially proliferate to a comparable extent. With current methods, one third of the antigen-reactive T cell receptor transgenic T cells enter into cycle for an average of three divisions in 3 d. The expansion of CD25+ CD4+ T cells stops by day 5, in the absence or presence of exogenous interleukin (IL)-2, whereas CD25- CD4+ T cells continue to grow. CD25+ CD4+ T cell growth requires DC-T cell contact and is partially dependent upon the production of small amounts of IL-2 by the T cells and B7 costimulation by the DCs. After antigen-specific expansion, the CD25+ CD4+ T cells retain their known surface features and actively suppress CD25- CD4+ T cell proliferation to splenic APCs. DCs also can expand CD25+ CD4+ T cells in the absence of specific antigen but in the presence of exogenous IL-2. In vivo, both steady state and mature antigen-processing DCs induce proliferation of adoptively transferred CD25+ CD4+ T cells. The capacity to expand CD25+ CD4+ T cells provides DCs with an additional mechanism to regulate autoimmunity and other immune responses.


Figures

Figure 1.
Figure 1.
DCs stimulate CD25+ CD4+ T cell growth. (A) 104 CD25+ or CD25 CD4+ FACS®-purified (top) DO11.10 OVA-specific T cells were cultured for 3d with 105 spleen APCs or 5 × 10³ CD86+ mature DCs and anti-CD3 mAb. [3H]thymidine uptake was assessed (60–72 h). (B) As in A, but T cells were from two OVA-specific TCR transgenic mice, DO11.10 and OT-2, and the DCs were pulsed or not pulsed with 1 mg/ml OVA protein. (C) CD25+ CD4+ T cells from wild-type BALB/c mice (♦) proliferate in response to DCs presenting anti-CD3 (right) but not OVA (left). (D and E) Day 6 marrow DCs were FACS® separated into mature CD86high and immature CD86low CD11c+ subsets (D) and cultured with CD25+ CD4+ DO11.10 T cells (E) with OVA protein (1 mg/ml pulsed onto the DCs) or 1 μg/ml OVA 323–339 peptide continuously. One representative result of at least three experiments is shown.
Figure 2.
Figure 2.
A large fraction of CD25+ CD4+ T cells are driven into multiple cell cycles by DCs. (A) As in Fig. 1, but the kinetics of proliferation ([3H]thymidine and cell counts) were both followed. (B) 104 CFSE-labeled T cells were cultured for 3 d with 104 CD86+ mature BM-DCs either OVA-pulsed (DC-OVA) or unpulsed (DC), before FACS® analysis. (C) Quantitative estimation of the number of T cells entering the cell cycle, and the number of mitotic events, was performed as follows. 104 CFSE-labeled CD25+ CD4+ T cells were cultured for 72 h with 1 mg/ml OVA-pulsed CD86+ BMDCs (104), and analyzed for dilution of CFSE label (C). The percentage of total CD4+ events under each division peak (a) was experimentally determined (b). In this experiment, 24,000 live T cells were recovered, from which the absolute T cell count in each division peak at the time of harvest could be calculated (c). The absolute number of original, or precursor, T cells required to have generated these daughters is extrapolated by dividing the numbers of cells in column c by the number of divisions, 2 n (d). The sum of the number of precursors giving rise to each peak represents the number of T cells at day 0 that entered cell cycle, which in this experiment was 3,020 (the sum of column d) from a starting number of 10,000 T cells, giving a precursor frequency of 30%. The number of progeny in each peak (c) minus the number of precursors giving rise to the progeny (d) gives the number of mitotic events (e). The sum of these events represents the total number of cell divisions that occurred in the T cell subset by the time of harvest. (D) The experiment and calculation in C was performed in a total of six experiments where the TCR stimulus was specific OVA antigen (n = 3) or anti-CD3 antibody (n = 3).
Figure 3.
Figure 3.
Role of IL-2 in CD25+ CD4+ T cell proliferation. (A) [3H]thymidine uptake by CD25+ or CD25+ CD4+ T cells alone (top), or T cells stimulated by CD86+ DCs not pulsed (middle) or pulsed (bottom) with OVA protein ± IL-2 or PC61 anti–IL-2R mAb. (B) As in A, but IL-2 effects on [3H]thymidine uptake and cell counts were assessed with time. (C) As in A, but anti–IL-2R mAb or control rat IgG was added to CD25+ CD4+ T cells stimulated with DCs from wild-type (WT) or IL-2−/− mice plus OVA peptide at 1 μg/ml for 3 d. The numbers above the bars indicate the amount of IL-2 detected by ELISA in the same culture. (D) IL-2 production (ELISA) after stimulation with DC-OVA or DCs. Statistical significance was determined using the unpaired Student's t test. *, P < 0.01.
Figure 4.
Figure 4.
Membrane costimulation of CD25+ CD4+ T cells by DCs. (A) Comparison of T cell responses to live (top, T/DC ratio of 1:1) or formaldehyde-fixed (bottom, T/DC ratio of 1:3) CD86+ mature marrow DCs plus DO11.10 peptide at 1 μg/ml for 3 d in the presence of the indicated concentrations of control and anti–IL-2R mAb. Statistical significance was determined using the unpaired Student's t test. *, P < 0.01. (B) Same as A, but the activity of aldehyde-fixed DCs were studied with DCs that were charged with OVA (DC-OVA) or not (DC), and then added to CD25+ CD4+ and CD25 CD4+ T cells in the presence or absence of IL-2, with only the former subset responding to IL-2 in the absence of OVA (top left). (C) 104 marrow DCs were generated from wild-type (WT) or CD80/CD86 knockout mice and matured in 50 ng/ml LPS before culture with 104 CD25+ or CD25 CD4+ T cells (purified from OT-II mice spleen and lymph node cells) for 3 d with or without 0.5 μg/ml OVA peptide. The degree of proliferation was assessed by incorporation of [3H]thymidine for the last 12 h. One representative result of three independent experiments is shown.
Figure 5.
Figure 5.
CD25+ CD4+ T cells must contact DCs to proliferate actively. CFSE-labeled CD25+ CD4+ T cells (top) or CD25 CD4+ T cells (bottom) and the indicated stimuli were added to the inner and outer wells of transwell chambers, and the dilution of CFSE label per cell was followed by FACS® after 3 d of culture. Dead cells were gated out by TOPRO-3 staining. One representative result of three independent experiments is shown.
Figure 6.
Figure 6.
CD25+ CD4+ T cells expanded by mature BM-DCs retain phenotype and function. (A) Surface markers of CD25+ CD4+ and CD25 CD4+ T cells after 7-d expansion by mature CD86+ DC-OVA (shaded histogram, isotype control). (B) As in A, but the expression of the KJ1.26 clonotypic receptor in CD25+ CD4+ T cells is shown before and after 7 d of culture with DC-OVA. (C) 104 DO11.10 T cells were cultured for 7 d with an equal number of OVA-pulsed CD86+ marrow DCs. CD11c+ DCs were eliminated by MACS, and then the recovered T cells were used to respond to 5 × 10⁴ splenic APCs, or to suppress fresh CD25 CD4+ T cells in the presence of 1 μg/ml OVA peptide (top) or anti-CD3 mAb (bottom). (D) CD25+ CD4+ T cells purified from DO11.10 mice were expanded with OVA-pulsed mature DCs for 7 d as in C, with or without exogenous 100 U/ml IL-2. Fresh or cultured CD25+ CD4+ T cells were then mixed with freshly isolated CD25 CD4+ T cells from DO11.10 mice at the indicated ratios and cultured for 3 d. The degree of proliferation was assessed by incorporation of [3H]thymidine for the last 12 h. Representative results of three or more similar experiments. Statistical significance was determined using the unpaired Student's t test. *, P < 0.01.
Figure 7.
Figure 7.
CD25+ CD4+ T cells primarily proliferate to DCs as APCs. Proliferation was assessed by incorporation of [3H]thymidine for the last 12 h. (A) 104 T cells were cultured for 3 d with BM-DCs, spleen CD8+, or CD8 CD11c+ DCs matured by culture overnight in LPS, and CD19+ B cells matured in LPS. The APCs were exposed to 1 mg/ml OVA before use. Data with APCs lacking OVA were <103 cpm and are omitted. (B) As in A, but BM-DCs were compared with spleen CD8+ or CD8 CD11c+ DCs, either fresh immature cells or matured by culture overnight, along with 1 μg/ml DO11.10 peptide. (C) As in A, but DCs were compared with macrophages, either PECs, TGC-elicited PEC, or IFN-γ–treated TGC-PEC. (D) CD25+ CD4+ T cells from DO11.10 mice were cultured for 3 d with lymph node CD11c+ DCs from untreated mice, or mice 5 d after CFA injection s.c. Representative results from three similar experiments.
Figure 8.
Figure 8.
DCs stimulate CD25+ CD4+ and CD25 CD4+ T cell proliferation in vivo. (A) 0.7 × 10⁶ CFSE-labeled T cells were injected i.v. and stimulated with 2 × 10⁵ marrow DCs or DC-OVA injected s.c. into the footpads 1 d later. Clonotype positive (KJ1.26+) TCR transgenic T cells (top, circle) were analyzed for proliferation and expression of CD25 3 d later by dilution of the CFSE label in draining or distal (mesenteric) lymph nodes. (B) As in A, but OVA antigen was delivered by the injection of 25 μg soluble OVA into each footpad in the steady state. One representative result of three similar experiments.

Similar articles

Cited by

References

    1. Sakaguchi, S., N. Sakaguchi, J. Shimizu, S. Yamazaki, T. Sakihama, M. Itoh, Y. Kuniyasu, T. Nomura, M. Toda, and T. Takahashi. 2001. Immunologic tolerance maintained by CD25+ CD4+ regulatory T cells: their common role in controlling autoimmunity, tumor immunity, and transplantation tolerance. Immunol. Rev. 182:18–32. - PubMed
    1. Shevach, E.M. 2000. Regulatory T cells in autoimmunity. Annu. Rev. Immunol. 18:423–449. - PubMed
    1. Saoudi, A., B. Seddon, V. Heath, V. Fowell, and D. Mason. 1996. The physiological role of regulatory T cells in the prevention of autoimmunity: the function of the thymus in the generation of the regulatory T cell subset. Immunol. Rev. 149:195–216. - PubMed
    1. Sakaguchi, S., N. Sakaguchi, M. Asano, M. Itoh, and M. Toda. 1995. Immunologic self-tolerance maintained by activated T cells expressing IL-2 receptor alpha-chains (CD25). Breakdown of a single mechanism of self-tolerance causes various autoimmune diseases. J. Immunol. 155:1151–1164. - PubMed
    1. Asano, M., M. Toda, N. Sakaguchi, and S. Sakaguchi. 1996. Autoimmune disease as a consequence of developmental abnormality of a T cell subpopulation. J. Exp. Med. 184:387–396. - PMC - PubMed

Publication types

Substances