. 2003 Sep 2;100(18):10552-7.
doi: 10.1073/pnas.1633615100. Epub 2003 Jul 21.

Simultaneous analysis of phytohormones, phytotoxins, and volatile organic compounds in plants

Affiliations

Simultaneous analysis of phytohormones, phytotoxins, and volatile organic compounds in plants

Eric A Schmelz et al. Proc Natl Acad Sci U S A. .

Abstract

Phytohormones regulate the protective responses of plants against both biotic and abiotic stresses by means of synergistic or antagonistic actions referred to as signaling crosstalk. A bottleneck in crosstalk research is the quantification of numerous interacting phytohormones and regulators. The chemical analysis of salicylic acid, jasmonic acid, indole-3-acetic acid, and abscisic acid is typically achieved by using separate and complex methodologies. Moreover, pathogen-produced phytohormone mimics, such as the phytotoxin coronatine (COR), have not been directly quantified in plant tissues. We address these problems by using a simple preparation and a GC-MS-based metabolic profiling approach. Plant tissue is extracted in aqueous 1-propanol and mixed with dichloromethane. Carboxylic acids present in the organic layer are methylated by using trimethylsilyldiazomethane; analytes are volatilized under heat, collected on a polymeric absorbent, and eluted with solvent into a sample vial. Analytes are separated by using gas chromatography and quantified by using chemical-ionization mass spectrometry that produces predominantly [M+H]+ parent ions. We use this technique to examine levels of COR, phytohormones, and volatile organic compounds in model systems, including Arabidopsis thaliana during infection with Pseudomonas syringae pv. tomato DC3000, corn (Zea mays) under herbivory by corn earworm (Helicoverpa zea), tobacco (Nicotiana tabacum) after mechanical damage, and tomato (Lycopersicon esculentum) during drought stress. Numerous complex changes induced by pathogen infection, including the accumulation of COR, salicylic acid, jasmonic acid, indole-3-acetic acid, and abscisic acid illustrate the potential and simplicity of this approach in quantifying signaling crosstalk interactions that occur at the level of synthesis and accumulation.


Figures
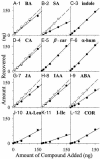
Fig. 1.
Fig. 1.
Recovery and quantification of 12 synthetic analytes with VPE by using internal and external standards. Total recovery (•) was calculated by adding 0, 10, 25, 50, 100, or 150 ng of the following VOCs and free carboxylic acids to plant tissue samples (200 mg). (A-1)BA(y = 0.84x). (B-2)SA(y = 0.50x). (C-3) Indole (y = 0.93x). (D-4)CA(y = 0.90x). (E-5) β-Caryophylene (β-car; y = 0.99x). (F-6) α-Humulene (α-hum; y = 1.01x). (G-7)JA(y = 0.80x). (H-8) IAA (y = 0.86x). (I-9) ABA (y = 0.68x). (J-10) JA-Leu (y = 0.53x). (K-11) I-Ile (y = 0.34x). (L-12) COR (y = 0.57x). Sample preparation followed the described VPE protocol (see Materials and Methods), and [M+H]+ m/z MS responses were compared with the slope of external standard curves generated for each VOC and carboxylic acid ME. By using commercially available internal standards for BA (A-1, y = 0.96x), SA (B-2, y = 0.96x), CA (D-4, y = 0.99x), JA (G-7, y = 1.00x), IAA (H-8, y = 0.99x), and ABA (I-9, y = 0.99x), a second estimate for recovery (○) was made that computationally corrected for losses. Slopes (y), correlation coefficients (all r2 ≥ 0.97), and error bars (mean ± SEM, n = 4, obscured by plot symbols) indicate the recoveries, accuracy, and reproducibility of this method for each analyte.
Fig. 2.
Fig. 2.
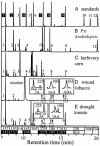
(A) In a plant matrix background, selected-ion chromatograms of the internal and external standards for the VOCs and carboxylic acid MEs (white numbers on black background indicate isotopically labeled compounds): 1, [13C6]BA-ME; 2, [2H4]SA-ME; 3, indole; 4, [2H5]CA-ME; 5, β-caryophyllene; 6, α-humulene; 7, dhJA-ME; 8, [2H5]IAA-ME; 9, [2H6]ABA-ME; 10, JA-Leu-ME; 11, I-Ile-ME; and 12, COR-ME. (B-E) Proportionally scaled single-ion chromatograms of endogenous analytes for Pst-infected Arabidopsis (B), CEW herbivory on corn (C), wounded tobacco (D), and drought-stressed tomato (E). Endogenous compounds confirmed and quantified include: 1, BA-ME; 2, SA-ME; 3, indole; 4, CA-ME; 5, caryophyllene; 7, JA-ME; 8, IAA-ME; 9, ABA-ME; and 12, COR-ME. Because of the presence of secondary metabolites, phytohormones appear visually as minor components; examples of expanded single-ion chromatograms for JA, IAA, and ABA are illustrated in tobacco and tomato (Insets in D and E). The x axis denotes GC retention times and [M+H]+ m/z ions used for quantitation purposes of internal standards (black background) and native analytes (white background). The y axis is the relative ion intensity (%).
Fig. 3.
Fig. 3.
Infection of Arabidopsis with Pst results in large-scale profile changes over time. Shown are mean (±SEM, n = 3) BA, SA, JA, IAA, ABA, and COR (A-F, respectively) tissue levels (ng/g FW) of control (○) and Pst-infected (•) leaf tissue. Asterisks denote significant increases above the time 0 control (P < 0.05, Dunnett's test).
Fig. 4.
Fig. 4.
CEW herbivory induces levels of JA and volatile metabolites but reduces IAA. (A) Mean (+SEM, n = 5) BA, SA, JA, IAA, and ABA levels (ng/g FW) of corn plants 18 h after initiation of herbivory. (B) Mean levels of the VOCs (μg/g FW), indole (Ind) and caryophyllene (Car), induced by CEW herbivory. Asterisks denote significant differences between treatments (P < 0.05, t test).
Fig. 5.
Fig. 5.
Wounding increases JA and ABA but reduces IAA levels in tobacco, whereas drought stress selectively increases ABA levels in tomato. Mean (+SEM, n = 4) BA, SA, JA, IAA, and ABA levels (ng/g FW) in tobacco leaves 6 h after treatment (A) and tomato leaves (B). Potted plants were drought stressed by withholding water with leaf tissue harvested after 48 h showing early visual symptoms of reduced turgor. Asterisks denote significant differences between treatments (P < 0.05, t test).

Comment in

  • Hormones are in the air.
    Klee H. Klee H. Proc Natl Acad Sci U S A. 2003 Sep 2;100(18):10144-5. doi: 10.1073/pnas.1934350100. Epub 2003 Aug 26. Proc Natl Acad Sci U S A. 2003. PMID: 12941867 Free PMC article. No abstract available.

References

    1. Zhu, J. K. (2002) Annu. Rev. Plant Biol. 53, 247-273. - PMC - PubMed
    1. de Bruxelles, G. L. & Roberts, M. R. (2001) Crit. Rev. Plant Sci. 20, 487-521.
    1. Kunkel, B. N. & Brooks, D. M. (2002) Curr. Opin. Plant Biol. 5, 325-331. - PubMed
    1. Xu, Y., Chang, P. F. L., Liu, D., Narasimhan, M. L., Raghothama, K. G., Hasegawa, P. M. & Bressan, R. A. (1994) Plant Cell 6, 1077-1085. - PMC - PubMed
    1. Zhu-Salzman, K., Salzman, R. A., Koiwa, H., Murdock, L. L., Bressan, R. A. & Hasegawa, P. M. (1998) Physiol. Plant. 104, 365-372.

Publication types

MeSH terms

LinkOut - more resources