. 2003 Aug;19(4):213-23.
doi: 10.1002/hbm.10112.

Cross-modal sensory processing in the anterior cingulate and medial prefrontal cortices

Affiliations

Cross-modal sensory processing in the anterior cingulate and medial prefrontal cortices

Paul J Laurienti et al. Hum Brain Mapp. 2003 Aug.

Abstract

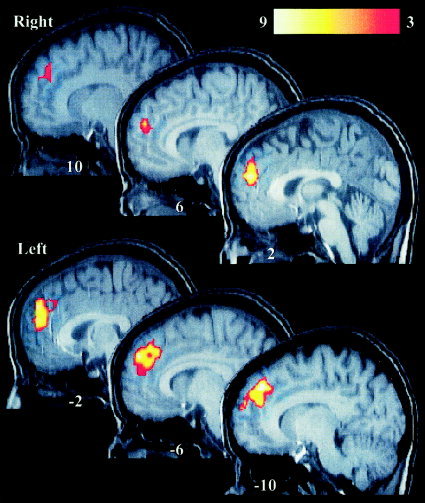
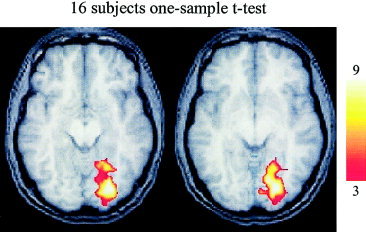
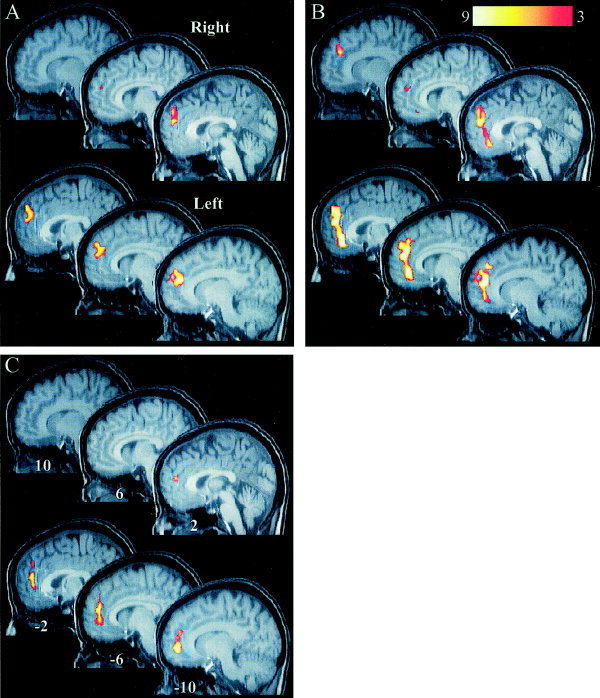
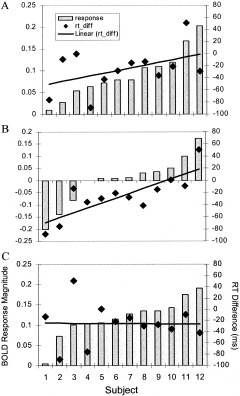
One of the principal functions of the nervous system is to synthesize information from multiple sensory channels into a coherent behavioral and perceptual gestalt. A critical feature of this multisensory synthesis is the sorting and coupling of information derived from the same event. One of the singular features of stimuli conveying such information is their contextual or semantic congruence. Illustrating this fact, subjects are typically faster and more accurate when performing tasks that include congruent compared to incongruent cross-modal stimuli. Using functional magnetic resonance imaging, we demonstrate that activity in select brain areas is sensitive to the contextual congruence among cross-modal cues and to task difficulty. The anterior cingulate gyrus and adjacent medial prefrontal cortices showed significantly greater activity when visual and auditory stimuli were contextually congruent (i.e., matching) than when they were nonmatching. Although activity in these regions was also dependent on task difficulty, showing decreased activity with decreasing task difficulty, the activity changes associated with stimulus congruence predominated.


Figures

Figure 1
Figure 1
Areas showing significantly greater activation during the matching condition when compared to the nonmatching condition. Top: Sagittal slices from the right hemisphere. Bottom: Slices from the left hemisphere. The y coordinate in Talairach space is labeled on each section. The color calibration bar represents the T score for all sections. All activation maps in this and subsequent figures are in neurological space and are overlaid on a typical T1‐weighted image that has been normalized to Talairach space.
Figure 2
Figure 2
Areas showing significantly greater activation during the nonmatching condition compared to the matching condition. The large cluster is located in the ventral visual cortex on the right. A region of activity was present in a similar location on the left but did not survive correction for multiple comparisons. The axial slices are located at z = −8 and z = −2 from left to right. The color calibration bar represents the T score magnitude.
Figure 3
Figure 3
Areas of significant difference in activation between matching and nonmatching conditions from the 12 subject analyses. A: Activation maps from the one‐sample t‐test identified regions of differential activation in the prefrontal cortex just superior to the anterior cingulate gyrus. B: Activation maps corrected for RT differences (ANCOVA analysis) identified more extensive regions of differential activation that encompassed both the medial prefrontal and anterior cingulate cortices. C: Activation maps for the ANCOVA identifying regions whose changes in activity can be attributed to decreased response times (match RT–nonmatch RT). This area of activity is focused in the inferior aspect of the anterior cingulate gyrus. Top: Sagittal sections from the right hemisphere. Bottom: Sections from the left hemisphere. The color calibration bar shown in B applies to all images and represents the T score magnitude. The y coordinate in Talairach space is labeled on each section in C and applies to all figures.
Figure 4
Figure 4
Bold response magnitude and RT difference plots for the 12 subject analyses. The response plots (left axes) are displayed in normalized, arbitrary units. The RT difference plots (rt_diff) refer to the right axes and are in msec. A: Plots of the response magnitude (match–nonmatch) from the peak voxel in the ACG generated from the one‐sample t‐test are arranged in ascending order. The RT difference for each subject is shown in the same column as the response magnitude. The linear regression through the rt_diff data is shown as the solid black line (R2 = 0.2). B: The response magnitude plots represent the response attributed to the difference in RT (match RT–nonmatch RT) from the ANCOVA. The data have been arranged in ascending order by response magnitude (note that the subject order changes for each of the plots). The linear regression through the rt_diff data exhibits a better fit with R2 increasing to 0.65. C: Plots of the response magnitude (match–nonmatch) from the peak voxel in the ACG generated from ANCOVA. Following removal of the variance attributed to the difference in RT, the response magnitude no longer correlated with the rt_diff. All subjects exhibited an increase in response in the ACG during matching compared to nonmatching with an increase in the magnitude of response across the group.
Figure 5
Figure 5
Areas showing significantly greater activation during the nonmatching condition from the 12 subject analyses. The bilateral activation in the ventral visual cortex was observed in both analyses. The activity on the right is located in the same region as observed in the 16 subject analysis. The activity on the left survived correction for multiple comparisons in both 12‐subject analyses but did not survive in the 16‐subject analysis. The axial slices are located at z = −5 and z = 39 from left to right for each analysis. The color calibration bar applies to all images and represents the T score magnitude.

References

    1. Aitken PG (1980): Lesion effects on tactual to visual cross‐modal matching in the rhesus monkey. Neuropsychologia 18: 575–578. - PubMed
    1. Alsop DC (1995): Correction of ghost artifacts and distortion in echo‐planar mr‐imaging with an iterative image‐reconstruction technique. Radiology 197: 388–388.
    1. Andreassi JL, Greco JR (1975): Effects of bisensory stimulation on reaction time and the evoked cortical potential. Physiol Psychol 3: 189–194.
    1. Badgaiyan RD, Posner MI (1998): Mapping the cingulate cortex in response selection and monitoring. Neuroimage 7: 255–260. - PubMed
    1. Badgaiyan RD, Schacter DL, Alpert NM (1999): Auditory priming within and across modalities: Evidence from positron emission tomography. J Cogn Neurosci 11: 337–348. - PubMed

Publication types

LinkOut - more resources