. 2003 Aug;163(2):413-22.
doi: 10.1016/S0002-9440(10)63671-1.

Temporal and spatial patterns of expression of inhibitors of apoptosis in human placentas

Affiliations

Temporal and spatial patterns of expression of inhibitors of apoptosis in human placentas

Hakhyun Ka et al. Am J Pathol. 2003 Aug.

Abstract

The apoptosis cascade that plays a central role in normal and pathological processes is strictly controlled, in part by newly described members of the inhibitor of apoptosis (IAP) family (HIAP-1, HIAP-2, XIAP, NAIP, Survivin, and Livin). Here, we report the expression of IAP mRNAs and proteins in early and late gestation human placentas, term cytotrophoblast cells, and two choriocarcinoma cell lines, JEG-3 and Jar. Reverse transcriptase-polymerase chain reaction identified mRNAs derived from all of the currently known IAP genes in all samples. Analysis by immunoblotting revealed that IAP proteins are present in early and late gestation human placentas and that levels of IAPs are not identical in normal and transformed trophoblast cells. Immunohistochemical experiments performed on paraformaldehyde-fixed tissue sections taken from early and late stages of pregnancy demonstrated that expression patterns differed according to cell lineage and stage of cell differentiation. The results of this study are consistent with the postulate that IAP proteins have critical roles in placental cell survival and suggest that specific apoptosis inhibitors may protect normal and transformed trophoblast cells from cell death.


Figures

Figure 1.
Figure 1.
RT-PCR analysis of IAP mRNAs in human placentas. A: Placental tissue samples from first trimester (TM) (n = 6) and term placentas (n = 6) were tested. β-actin was used as a loading control. Molecular weight markers (M) are noted to indicate bp of PCR products. Sequencing experiments demonstrated authenticity of PCR products. B: The ratio of each IAP mRNA density to β-actin mRNA density obtained by scanning densitometry. *, P < 0.05 when compared with first trimester.
Figure 2.
Figure 2.
Immunoblot analysis of IAP proteins in human placentas. A: Placental tissue samples from first trimester (TM) (n = 6) and term placentas (n = 6) were tested. Molecular weight (kd) of each protein is indicated on the left. Actin was used as a loading control. B: The ratio of each IAP protein density to actin density obtained by scanning densitometry.
Figure 3.
Figure 3.
Photomicrographs illustrating representative localization of IAP proteins by immunohistochemistry in human placentas. Specific immunostaining signals were not detected when the primary antibodies were substituted with their respective normal rabbit IgG, mouse IgG, or preimmune rabbit serum (control). TM, trimester; vCTB, villous cytotrophoblast cells; STB, syncytiotrophoblast layer; FM, fetal mesenchyme; IVS, intervillous space. Original magnifications, ×400.
Figure 4.
Figure 4.
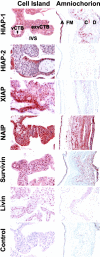
Photomicrographs illustrating representative localization of IAP proteins by immunohistochemistry in extravillous cytotrophoblast cells present in cell columns of first trimester placentas and amniochorion membranes of term placentas. Specific immunostaining signals were not detected when the primary antibodies were substituted with their respective normal rabbit IgG, mouse IgG, or preimmune rabbit serum (control). vCTB, villous cytotrophoblast cells; exvCTB, extravillous cytotrophoblast cells; IVS, intervillous space; A, amniotic epithelia; FM, fetal mesenchyme; C, chorionic membrane; D, decidua capsularis. Original magnifications, ×400 for cell columns; ×200 for amniochorion.
Figure 5.
Figure 5.
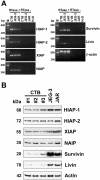
RT-PCR (A) and immunoblot (B) analyses of IAP expression in cytotrophoblast cells (CTB) and choriocarcinoma cell lines, JEG-3 and Jar. Cytotrophoblast cells for immunoblot analysis were from three different term placentas. Molecular weight markers (M) are noted to indicate bp of PCR products, and the molecular weight (kd) of each protein is indicated. Note that messages for IAPs are present in cytotrophoblast cells and choriocarcinoma cell lines, but proteins are detectable in an inhibitor type-specific manner. RTase +/−, with (+) or without (−) reverse transcriptase.

References

    1. Strasser A, O’Connor L, Dixit VM: Apoptosis signaling. Annu Rev Biochem 2000, 69:217-245 - PubMed
    1. Bortner CD, Cidlowski JA: Cellular mechanisms for the repression of apoptosis. Annu Rev Pharmacol Toxicol 2002, 42:259-281 - PubMed
    1. Rothe M, Pan MG, Henzel WJ, Ayres TM, Goeddel DV: The TNFR2-TRAF signaling complex contains two novel proteins related to baculoviral inhibitor of apoptosis proteins. Cell 1995, 83:1243-1252 - PubMed
    1. Deveraux QL, Reed JC: IAP family proteins—suppressors of apoptosis. Genes Dev 1999, 13:239-252 - PubMed
    1. Verhagen AM, Coulson EJ, Vaux DL: Inhibitor of apoptosis proteins and their relatives: IAPs and other BIRPs. Genome Biol 2001, 2:3009.1-3009.10 - PMC - PubMed

Publication types

MeSH terms