. 2003 Aug 5;100(16):9330-5.
doi: 10.1073/pnas.1633513100. Epub 2003 Jul 22.

Profiling receptor tyrosine kinase activation by using Ab microarrays

Affiliations

Profiling receptor tyrosine kinase activation by using Ab microarrays

Ulrik B Nielsen et al. Proc Natl Acad Sci U S A. .

Abstract

Signal transduction in mammalian cells is mediated by complex networks of interacting proteins. Understanding these networks at a circuit level requires devices to measure the amounts and activities of multiple proteins in a rapid and accurate manner. Ab microarrays have previously been applied to the quantification of labeled recombinant proteins and proteins in serum. The development of methods to analyze intracellular signaling molecules on microarrays would make Ab arrays widely useful in systems biology. Here we describe the fabrication of multiplex Ab arrays sensitive to the amounts and modification states of signal transduction proteins in crude cell lysates and the integration of these arrays with 96-well microtiter plate technology to create microarrays in microplates. We apply the Ab arrays to monitoring the activation, uptake, and signaling of ErbB receptor tyrosine kinases in human tumor cell lines. Data obtained from multicolor ratiometric microarrays correlate well with data obtained by using traditional approaches, but the arrays are faster and simpler to use. The integration of microplate and microarray methods for crude cell lysates should make it possible to identify and analyze small molecule inhibitors of signal transduction processes with unprecedented speed and precision. We demonstrate the future potential of this approach by characterizing the action of the epidermal growth factor receptor inhibitor PD153035 on cells by using Ab arrays; direct scale-up to array-based screening in 96- and 384-well plates should allow small molecules to be identified with specific inhibitory profiles against a signaling network.


Figures

Fig. 1.
Fig. 1.
Multiplex detection of protein antigens on Ab microarrays. (A) Detection of directly labeled recombinant antigen. Ab arrays were incubated with 25 ng/ml purified Cy3-labeled TfR ECD (green), Alexa 488-labeled ErbB2 ECD (blue), and Cy5-labeled EGFR ECD (red) individually or with the proteins as a mixture (fourth panel). (B) Detection of recombinant antigen by using microsandwich assays. Arrays were incubated with unlabeled purified antigens at 25 ng/ml, individually or as a mixture, and detected with a mixture of Cy3-labeled anti-TfR Ab (clone 7F8, green), Alexa 488-labeled anti-ErbB2 Ab (clone F5, blue), and Cy5-labeled anti-EGF receptor Ab (clone 199.12, red). (C) Sensitivity of EGFR detection. Slides were incubated with varying amounts of labeled recombinant EGFR ECD (Left), and fluorescence was quantified. Alternatively, varying amounts of unlabeled recombinant EGFR ECD (Right) was bound to arrays and detected by using fluorescently labeled anti-EGFR. All data represent triplicate spots from a single array; error bars represent SDs. (D) Detection of antigens in cell lysates by direct labeling of antigen or by microsandwich assay. A-431 and SK-BR-3 cancer cell lines were surface-labeled with polyethylene glycol-conjugated fluorescent dyes and antigens detected on Ab microarrays. Alternatively, antigens in cell lysates from A431 cells were detected with fluorescently labeled second Abs. (E) Multiplex detection of antigens in lysates of tumor cell lines by using microsandwich assays. Slides were incubated with unlabeled cell lysates from various cell lines and detected with a mixture of Alexa 488-labeled anti-TfR Ab (clone 7F8, blue), Cy5-labeled anti-ErbB2 (clone 3B5, red), and Cy5-labeled anti-EGFR (clone 1991.2, red). For comparison, the relative abundance of each receptor was measured on whole cells by flow cytometry by using the same Abs (Right).
Fig. 2.
Fig. 2.
Ratiometric detection of receptor tyrosine phosphorylation and expression. The abundance and phosphorylation of EGFR and ErbB2 was measured in the cell lines A-431, SK-BR-3, MCF-7, and ErbB2-transfected MCF-7 before and after 5 min of treatment with EGF. (A) Analyses of the response of SK-BR-3 cells to treatment with EGF. Ab arrays were incubated with cell lysates, and the captured antigens were analyzed with a mixture of five fluorescently labeled detection Abs: Alexa 488-labeled anti-TfR Ab (blue), Cy5-labeled pan-specific anti-ErbB2 (clone 3B5) and anti-EGFR (clone 199.12) Abs (red), and Cy3-labeled phospho-specific anti-pY1248 ErbB2 (clone PN2A) and anti-pY1068 EGFR (pAb pY1068) Abs (green). Signals were quantified, and the ratio of Cy3 signal (phospho-specific Ab) to Cy5 signal (pan-specific Ab) was determined. Immunoblotting was performed on the same SK-BR-3 cell lysates by using pan- and phospho-specific Abs. (B and C) Analyses of response of A-431 and MCF-7 cells transfected with ErbB2 to EGF, as described in A.(D) Linearity and sensitivity of the microsandwich assays as determined by dilution experiments with lysates. Lysates of MCF-7 cells transfected with ErbB2 were diluted into MCF-7 lysates to determine the linearity of array-based determinations of ErbB2 protein and ErbB2 phosphorylation levels and the sensitivity of measurements of the stoichiometry of phosphorylation to sample dilution. Error bars represent SDs of three replicate spots.
Fig. 3.
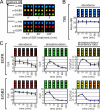
Fig. 3.
Microarray analysis of receptor activation. (A) SK-BR-3 cells were treated with EGF for 2 h, and cell lysates were analyzed at different times during this treatment by using Ab microarrays and microsandwich detection, as described in the Fig. 2 legend. (B) Quantification of transferrin receptor levels as a control for repeatability. (C) Quantification of protein abundance, phosphorylation, and the fraction of phosphorylated receptor for EGFR and ErbB2. See the Fig. 2 legend for details.
Fig. 4.
Fig. 4.
Microarray analysis of a tyrosine kinase inhibitor and integration of microarrays and microplates. (A) Inhibition of EGFR and ErbB2 phosphorylation in cells treated with the small molecule PD 153035. Error bars represent SDs of three replicate spots. (B) MIMs. Ab arrays were printed on glass slides and then attached to bottomless 96-well plates. A common pool of lysate from A431 cells was then added to each well, the plates were washed by using a BIOTEK plate washer, and bound antigen was detected by using a mixture of fluorescently labeled Abs as described in Fig. 1. Each well contained 18 spots, and portions of four wells are shown magnified. The coefficient of variation among similar spots in different wells was ≈20%. To the right, the IC50 for PD 153035 on EGFR-PY1068 was determined from cells grown in 24-well multi-plates, lysed in situ, and analyzed by using MIMs. Error bars represent the mean and range of triplicate spots.

References

    1. DeRisi, J. L., Iyer, V. R. & Brown, P. O. (1997) Science 278, 680–686. - PubMed
    1. Wiese, R., Belosludtsev, Y., Powdrill, T., Thompson, P. & Hogan, M. (2001) Clin. Chem. 47, 1451–1457. - PubMed
    1. Ekins, R., Chu, F. & Biggart, E. (1990) Ann. Biol. Clin. (Paris) 48, 655–666. - PubMed
    1. Ekins, R. & Chu, F. (1992) Ann. Biol. Clin. (Paris) 50, 337–353. - PubMed
    1. Moody, M. D., Van Arsdell, S. W., Murphy, K. P., Orencole, S. F. & Burns, C. (2001) BioTechniques 31, 186–194. - PubMed

Publication types