Comparative Study
. 2003 Jul 21;162(2):185-98.
doi: 10.1083/jcb.200301136.

A novel role for dp115 in the organization of tER sites in Drosophila

Affiliations
Comparative Study

A novel role for dp115 in the organization of tER sites in Drosophila

Vangelis Kondylis et al. J Cell Biol. .

Abstract

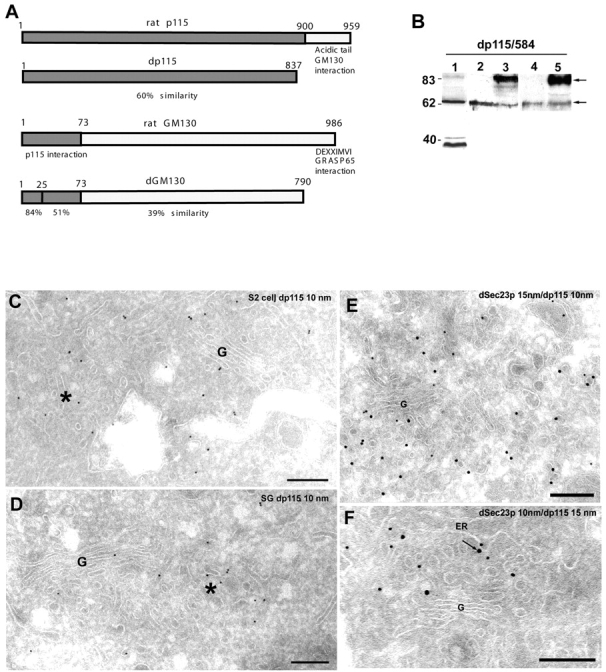
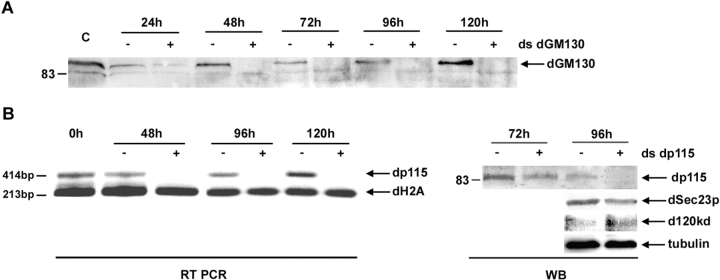
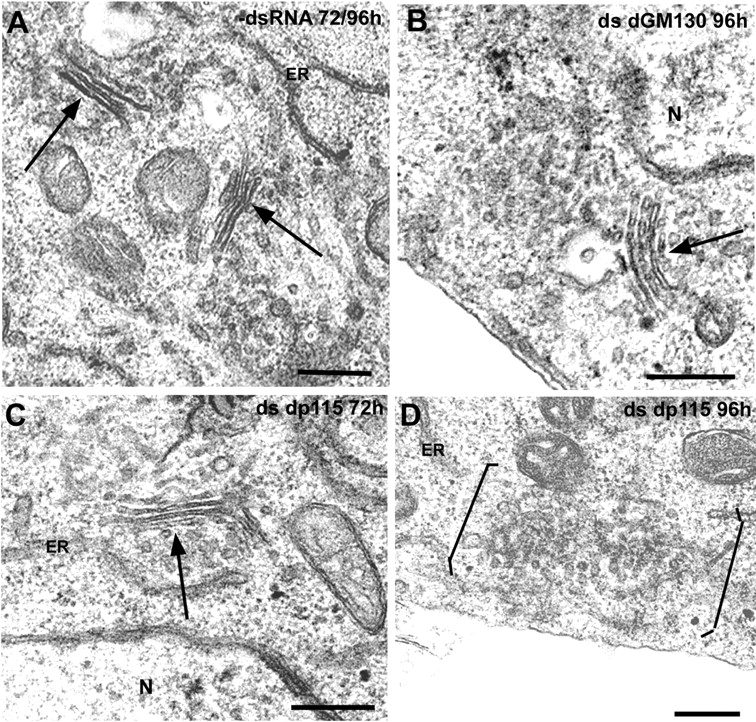
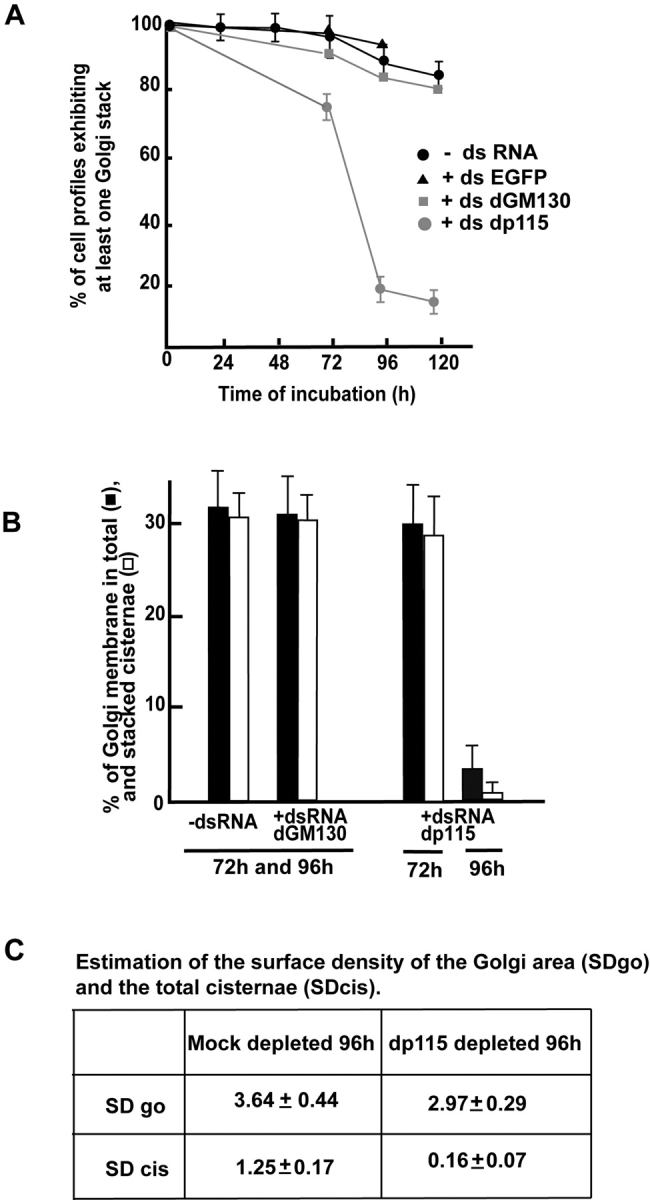
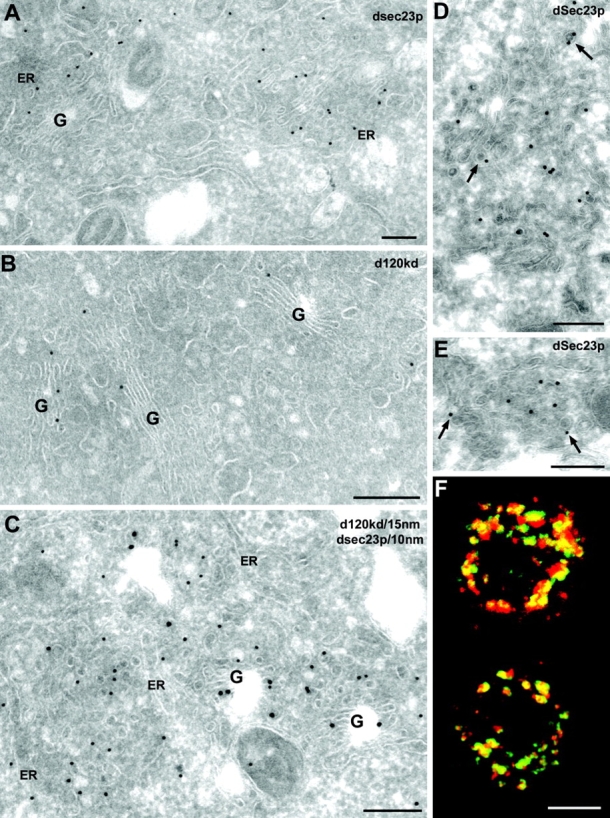
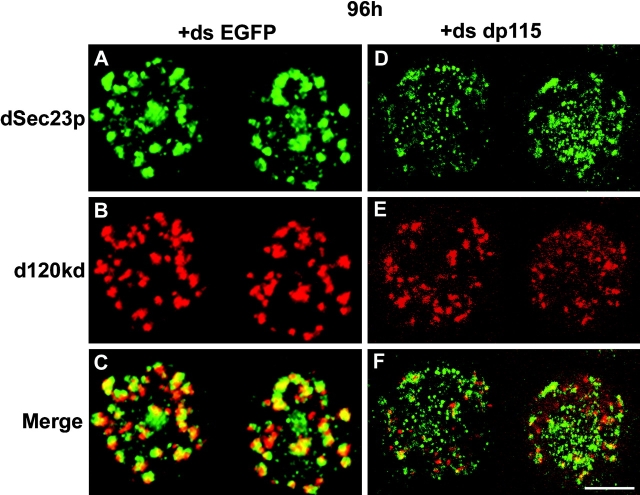
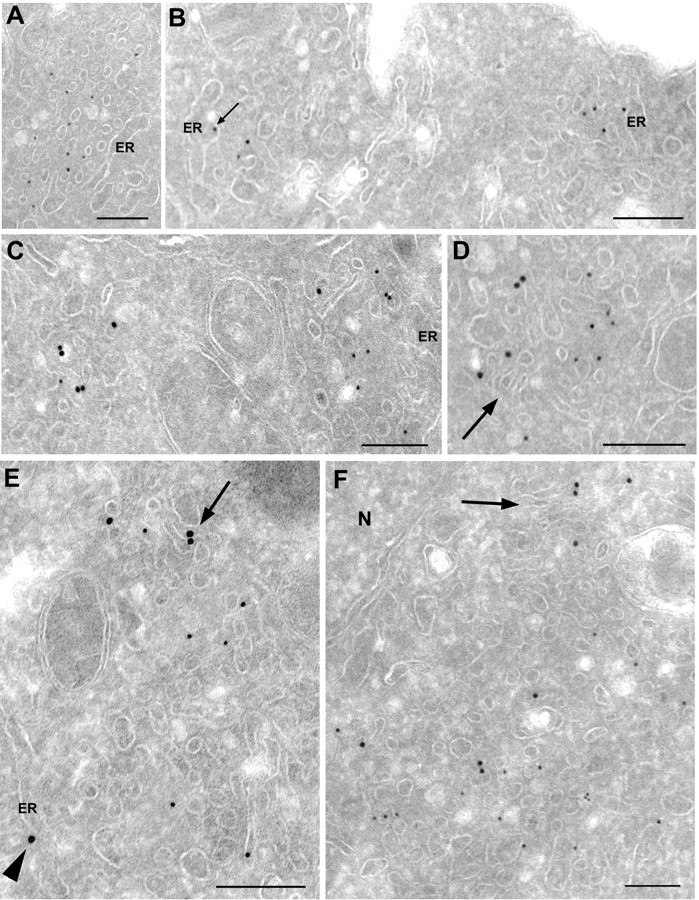
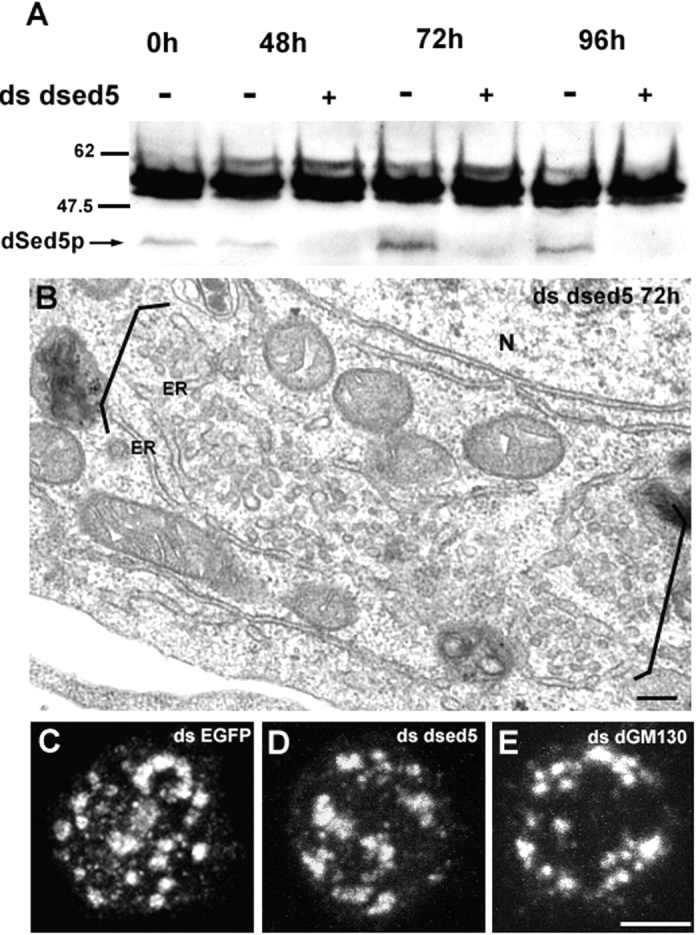
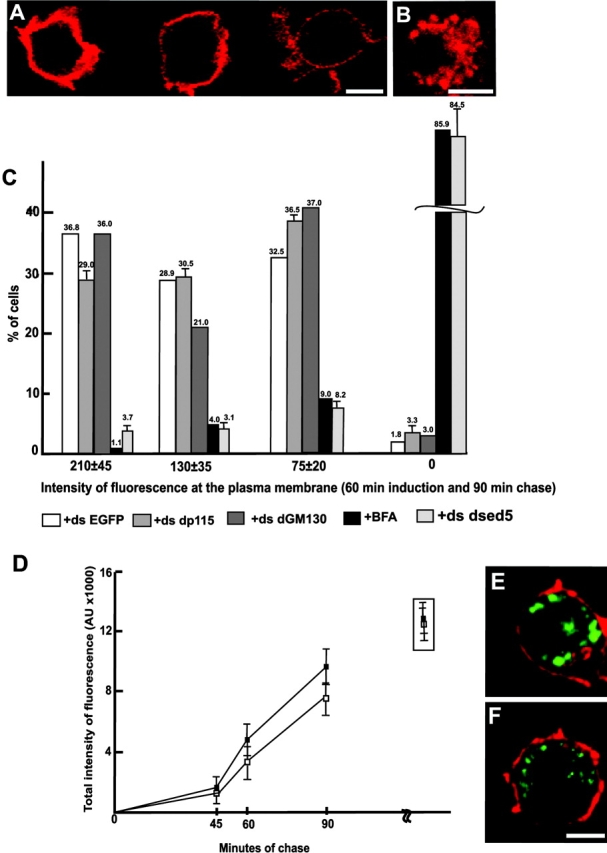
Here, we describe that depletion of the Drosophila homologue of p115 (dp115) by RNA interference in Drosophila S2 cells led to important morphological changes in the Golgi stack morphology and the transitional ER (tER) organization. Using conventional and immunoelectron microscopy and confocal immunofluorescence microscopy, we show that Golgi stacks were converted into clusters of vesicles and tubules, and that the tERs (marked by Sec23p) lost their focused organization and were now dispersed throughout the cytoplasm. However, we found that this morphologically altered exocytic pathway was nevertheless largely competent in anterograde protein transport using two different assays. The effects were specific for dp115. Depletion of the Drosophila homologues of GM130 and syntaxin 5 (dSed5p) did not lead to an effect on the tER organization, though the Golgi stacks were greatly vesiculated in the cells depleted of dSed5p. Taken together, these studies suggest that dp115 could be implicated in the architecture of both the Golgi stacks and the tER sites.


Figures

Figure 1.
Figure 1.
dp115 in Drosophila S2 cells. (A) dGM130 and dp115 proteins were compared with their rat homologues, and the domains of highest homology are painted in dark gray. (B) Western blotting using the affinity-purified dp115/584 of total S2 cell extract corresponding to 2,000,000 cells (lane 1), 4% of the cytosolic fraction of 10,000,000 cells (lane 2), the total membrane corresponding to 10,000,000 cells (lane 3), total extract corresponding to 20 embryos (lane 4), one third instar larva (lane 5). Two bands were recognized (small arrows on the right). Molecular mass markers are indicated on the left. (C–F) IEM of dp115 on Drosophila cells and tissues. Cryosections of PFA (C and E) and PFA/GA (F) fixed S2 cells and Drosophila third instar larvae salivary glands (D) were incubated with the affinity-purified dp115/584 and 10-nm protein A gold. (E) S2 cell sections were double labeled with the dp115/584 antibody followed by 10-nm protein A gold, and the Sec23p antibody followed by 15-nm protein A gold. (F) The same labeling was performed but the gold sizes are inverted. Golgi stacks are marked by a G, and pleiomorphic membranes are marked by an asterisk in C and D. The arrow indicates dp115 in an ER bud in F. Bars, 200 nm.
Figure 2.
Figure 2.
Depletion of dGM130 protein and dp115 mRNA. (A) Western blotting using MLO7 (anti-GM130 antibody) of the extract of S2 cells incubated with (+) or without (−) ds dGM130 for increasing lengths of time. C corresponds to time 0 (3,000,000 cells). 1,500,000 cells were used for lanes 24–72 h, and 2,500,000 for lanes 96–120 h. From the two bands the antibody recognizes, the stronger upper band is specifically depleted (arrow). (B) The dp115 mRNA was measured by RT-PCR from total RNA extract from 1,000,000 cells incubated with (+) or without (−) ds dp115 for 48–120 h. Amplification of histone 2A mRNA was used as control of the specific depletion of dp115 mRNA and as a loading control. Western blotting of the extract of cells (1,500,000) incubated with (+) or without (−) ds dp115 for 72 and 96 h using the dp115/584 antibody (dp115), the Sec23p antibody (dSec23p), the antibody recognizing the 120-kD Drosophila antigen (d120kd), and α-tubulin. Note that only dp115 is depleted.
Figure 3.
Figure 3.
Effect of depleting dp115 and dGM130 on the Golgi stack mor-phology. Drosophila S2 cells were cultured (A) in the absence (−dsRNA) or (B) presence of ds dGM130 for 96 h, or (C) in the presence of ds dp115 for 72 or (D) 96 h. Cells were collected and processed for conventional EM. Golgi stacks are indicated with a long arrow, and clusters of vesicles and tubules are marked between brackets. N, nucleus. Bars, 200 nm.
Figure 4.
Figure 4.
Quantitative analysis of the morphological effects after protein depletion. (A) Percentage of Golgi stacks in profiles of S2 cells depleted of dp115 and dGM130. S2 cells were incubated for 24 to 120 h with the different dsRNAs, processed for EM, and scored for the presence of at least one Golgi stack per cell profile. The results obtained are presented as a percentage of the total number of cells examined for each condition (∼300). (B) Stereological analysis of the Golgi area after protein depletion. Representative EM pictures of mock-treated cells and cells depleted of dGM130 and dp115 at 72 and 96 h were used to estimate the percentage of Golgi membrane in total cisternae (black bars) and stacked cisternae (white bars). The error bars represent the SD. (C) Estimation of the surface density of the Golgi area (SDgo) and the total cisternae (stacked and single) (SDcis) in mock- and dp115-depleted cells for 96 h. Results are expressed in μm−1 and ± represents SD.
Figure 5.
Figure 5.
Localization of d120kd and dSec23p in S2 cells. Cryosections of Drosophila S2 cells, fixed with PFA/GA (A–C) or PFA alone (D and E), were labeled (A, D, and E) with a polyclonal anti-Sec23p antibody (10-nm gold) or (B) a monoclonal antibody against d120kd (10-nm gold). (C) Sections were double labeled with the d120kd antibody (15-nm gold) and the anti-Sec23p antibody (10-nm gold). (F) Delta S2 cells were induced with CuSO4 for 25 min and processed for immunofluorescence. Delta and dSec23p were labeled using C594.9B (red) and the anti-Sec23p antibody (green), respectively. The merge projections of 30 confocal sections are presented, and the overlap is yellow. The COPII coats labeled for dSec23p are indicated with an arrow. G, Golgi stacks. Bars: (A–E) 200 nm; (F) 5 μm.
Figure 6.
Figure 6.
Effect of dp115 depletion on the organization of the tER sites. S2 cells were processed for confocal immunofluorescence microscopy using the anti-Sec23p antibody (green; A and D) and the d120kd antibody (red; B and E) in mock-depleted (+ds EGFP; A–C) and dp115-depleted cells (+ds dp115; D–F). Projections of 30 sections are presented, and in merge images (C and F), the overlap is yellow. Note that in mock-depleted cells, almost every dSec23p-positive structure is found in close proximity to a d120kd-positive one. Bar, 5 μm.
Figure 7.
Figure 7.
Localization of dSec23p and d120kd in dp115-depleted cells. S2 cells depleted of dp115 were processed for IEM and double labeled for dSec23p (10-nm gold) and d120kd (15-nm gold), as described in the legend of Fig. 5. (A–C) dSec23p-positive clusters. (C) d120kd-positive clusters. (D–F) Mixed clusters. A small arrow in B points to an ER bud labeled for dSec23p. Large arrows in D–F point to profiles reminiscent of Golgi cisternal remnants. Arrowhead in E points to a gold particle corresponding to d120kd associated with an ER cisterna. Note that in D–F, the labeling for dSec23p and d120kd marks differential regions of the same cluster. N, nucleus. Bars, 200 nm.
Figure 8.
Figure 8.
Effect of dSed5p depletion on the Golgi stack morphology and tER organization. (A) S2 cells were incubated with ds dsed5 up to 96 h. Extracts of mock- and dSed5p-depleted S2 cells were Western blotted using JSEE1 antibody. The 35-kD band corresponding to dSed5p is efficiently depleted (arrow). (B) The Golgi stack morphology in depleted cells was assessed by conventional EM. The cells exhibited no Golgi stacks, but extended areas completely vesiculated in >95% of the profiles examined. (C) The tER organization was monitored by immunofluorescence using the anti-Sec23p antibody, as described in the legend of Fig. 6, in control cells, (D) in cells depleted of dSed5p, and (E) in cells depleted of dGM130. N, nucleus. Bars: (B) 200 nm; (C–E) 5 μm.
Figure 9.
Figure 9.
Effect of protein depletion on Delta anterograde protein transport to the plasma membrane. Delta S2 cells were incubated for 96 h with ds EGFP, ds dp115, ds dGM130, and ds dsed5, or treated with brefeldin A (BFA) (see Materials and methods). (A) Representation of the three categories of plasma membrane labeling intensity, after a 1-h induction of Delta followed by a 90-min chase. One confocal section is presented. (B) Example of exclusive intracellular Delta labeling. (C) Percentage of cells exhibiting the three different intensities of plasma membrane or exclusive intracellular labeling after Delta induction for 1 h followed by 90 min of chase. Results obtained with mock-depleted cells (+ds EGFP), cells depleted of dp115 (+ds dp115), dGM130 (+ds dGM130), or dSed5p (+ds dsed5), or cells treated with brefeldin A are expressed as the percentage of total number of cells examined. The error bars represent the SD. (D) Initial rate of transport in dp115-depleted (empty symbols) and mock-depleted (filled symbols) cells induced for 25 min followed by 45, 60, and 90 min of chase. The intensity of Delta labeling at the plasma membrane was estimated as described in the Materials and methods and plotted against the chase time. The boxed results represent the total intensity obtained after a 1-h induction and 90-min chase. Immunofluorescence picture of a mock-depleted cell (E) with a control dSec23p pattern (green) and Delta at the plasma membrane (red), and of a dp115-depleted cell (F) with a fragmented dSec23p pattern (green) and the same amount of Delta at the plasma membrane (red). One confocal section is presented. Bar, 5 μm.

Similar articles

Cited by

References

    1. Allan, B.B., B.D. Moyer, and W.E. Balch. 2000. Rab1 recruitment of p115 into a cis-SNARE complex: programming budding COPII vesicles for fusion. Science. 289:444–448. - PubMed
    1. Alvarez, C., H. Fujita, A. Hubbard, and E. Sztul. 1999. ER to Golgi transport: requirement for p115 at a pre-Golgi VTC stage. J. Cell Biol. 147:1205–1222. - PMC - PubMed
    1. Alvarez, C., R. Garcia-Mata, H.P. Hauri, and E. Sztul. 2001. The p115-interactive proteins GM130 and giantin participate in endoplasmic reticulum-Golgi traffic. J. Biol. Chem. 276:2693–2700. - PubMed
    1. Banfield, D.K., M.J. Lewis, C. Rabouille, G. Warren, and H.R. Pelham. 1994. Localization of Sed5, a putative vesicle targeting molecule, to the cis-Golgi network involves both its transmembrane and cytoplasmic domains. J. Cell Biol. 127:357–371. - PMC - PubMed
    1. Bannykh, S.I., T. Rowe, and W.E. Balch. 1996. The organization of endoplasmic reticulum export complexes. J. Cell Biol. 135:19–35. - PMC - PubMed

Publication types

MeSH terms