. 2003 Oct 1;552(Pt 1):253-64.
doi: 10.1113/jphysiol.2003.048173. Epub 2003 Jul 23.

Intermittent hypoxia increases insulin resistance in genetically obese mice

Affiliations

Intermittent hypoxia increases insulin resistance in genetically obese mice

Vsevolod Y Polotsky et al. J Physiol. .

Abstract

Obstructive sleep apnoea, a syndrome that leads to recurrent intermittent hypoxia, is associated with insulin resistance in obese individuals, but the mechanisms underlying this association remain unknown. We utilized a mouse model to examine the effects of intermittent hypoxia on insulin resistance in lean C57BL/6J mice and leptin-deficient obese (C57BL/6J-Lepob) mice. In lean mice, exposure to intermittent hypoxia for 5 days (short term) resulted in a decrease in fasting blood glucose levels (from 173 +/- 11 mg dl-1 on day 0 to 138 +/- 10 mg dl-1 on day 5, P < 0.01), improvement in glucose tolerance without a change in serum insulin levels and an increase in serum leptin levels in comparison with control (2.6 +/- 0.3 vs. 1.7 +/- 0.2 ng ml-1, P < 0.05). Microarray mRNA analysis of adipose tissue revealed that leptin was the only upregulated gene affecting glucose uptake. In obese mice, short-term intermittent hypoxia led to a decrease in blood glucose levels accompanied by a 607 +/- 136 % (P < 0.01) increase in serum insulin levels. This increase in insulin secretion after 5 days of intermittent hypoxia was completely abolished by prior leptin infusion. Obese mice exposed to intermittent hypoxia for 12 weeks (long term) developed a time-dependent increase in fasting serum insulin levels (from 3.6 +/- 1.1 ng ml-1 at baseline to 9.8 +/- 1.8 ng ml-1 at week 12, P < 0.001) and worsening glucose tolerance, consistent with an increase in insulin resistance. We conclude that the increase in insulin resistance in response to intermittent hypoxia is dependent on the disruption of leptin pathways.


Figures
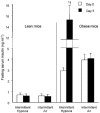
Figure 1
Figure 1. Fasting serum insulin levels in C57BL/6J (lean) and C57Bl/6J-Lepob (obese) mice were determined before (day 0) and after (day 5) exposure to either IH or IA for 5 days
These results are presented as the means ± s.e.m. The statistical significance of the difference between day 0 and day 5 within each group of animals or between animals exposed to intermittent hypoxia or intermittent air was derived with paired or unpaired t tests, respectively. * P < 0.01 for difference between day 0 and day 5; †P < 0.01 between mice exposed to IH and IA on day 5.
Figure 2
Figure 2. Blood glucose levels as a result of an IPGTT after a 5 day exposure to either IH or IA in lean mice, leptin-deficient obese mice and leptin-deficient obese mice receiving supplemental leptin
The change in the blood glucose from fasting levels was determined over a 2 h period after I.P. injection of glucose at 0.5 g kg−1 body weight in lean C57BL/6J mice (A), leptin-deficient obese C57Bl/6J-Lepob mice (B) and in C57Bl/6J-Lepob (obese) mice receiving leptin subcutaneously at 200 μg kg−1 day−1 (C). The IPGTT was performed after exposure to IH or IA for 5 days. The results show the mean of the change in blood glucose level (blood glucose level –fasting blood glucose level) ± s.e.m. The statistical significance of the difference between groups was derived with the method of generalized estimating equations (see Methods for the details). * P < 0.05 for the difference between groups.
Figure 3
Figure 3. Serum insulin levels as a result of an IPGTT after exposure to either IH or IA in lean mice, leptin-deficient obese mice and leptin-deficient obese mice receiving supplemental leptin
Serum insulin levels in C57BL/6J (lean) and C57Bl/6J-Lepob (obese) mice were determined before (fasting level) and 2 h after I.P. glucose injection (0.5 g kg−1 body weight) in the IPGTT. The IPGTT was performed after exposure to either IH or IA for 5 days. Results are presented as the means ± s.e.m. The statistical significance of the difference between fasting and 2 h IPGTT levels within each group of animals or between animals exposed to intermittent hypoxia or intermittent air was derived with paired or unpaired t tests, respectively. * P < 0.001 for difference between fasting and 2 h IPGTT levels; †P < 0.01 between mice exposed to IH and IA.
Figure 4
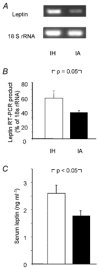
Figure 4. Expression of leptin mRNA and 18S rRNA in subcutaneous adipose tissue, and serum leptin levels in lean mice after exposure to either IH or IA for 5 days
In lean C57BL/6J mice, leptin mRNA and 18S rRNA expression in subcutaneous adipose tissue was assessed by RT-PCR (A and B), and fasting serum leptin levels (C) were measured by radioimmunoassay after exposure to IH (n = 9) or IA (n = 9) for 5 days. Ethidium bromide staining of an agarose gel shows representative RT-PCR yielded products of predicted size, 416 bp for leptin and 500 bp for 18S (A). Semi-quantitative determination of leptin mRNA expression is presented as a percentage of 18S rRNA RT-PCR product expression (B). Results are presented as the means ± s.e.m. The statistical significance of the difference between animals exposed to IH and IA was derived with an unpaired t test.
Figure 5
Figure 5. Fasting serum insulin levels in obese mice after exposure to either IH or IA for 12 weeks
Fasting serum insulin levels in C57Bl/6J-Lepob (obese) mice were determined before (baseline), during (weeks 4 and 8) and after exposure to IH or IA conditions for 12 weeks. Results are presented as the means ± s.e.m. Statistical significance of the difference between groups and over time was determined by two-way ANOVA. * P < 0.01 for difference between baseline, week 8 and week 12 levels for the IH group.
Figure 6
Figure 6. Blood glucose levels as a result of an IPGTT after a 12 week exposure to either IH or IA in obese mice
The change in the blood glucose from fasting levels was determined over a 2 h period after I.P. injection of glucose at 0.5 g kg−1 body weight in C57Bl/6J-Lepob (obese) mice following 12 weeks of exposure to IH and IA. Results are presented as the means of the change in blood glucose level (blood glucose level –fasting blood glucose level) ± s.e.m. The statistical significance of the difference between groups was derived with the method of generalized estimating equations (see Methods for the details). * P = 0.002 for the difference between groups, †P < 0.001 for the difference between groups.

References

    1. Ambrosini G, Nath AK, Sierra-Honigmann MR, Flores-Riveros J. Transcriptional activation of the human leptin gene in response to hypoxia. Involvement of hypoxia-inducible factor 1. J Biol Chem. 2002;277:34601–34609. - PubMed
    1. Arnalich F, Hernanz A, Lopez-Maderuelo D, Pena JM, Camacho J, Madero R, Vazquez JJ, Montiel C. Enhanced acute-phase response and oxidative stress in older adults with type II diabetes. Horm Metab Res. 2000;32:407–412. - PubMed
    1. Barzilai N, Wang J, Massilon D, Vuguin P, Hawkins M, Rossetti L. Leptin selectively decreases visceral adiposity and enhances insulin action. J Clin Invest. 1997;100:3105–3110. - PMC - PubMed
    1. Braun B, Rock PB, Zamudio S, Wolfel GE, Mazzeo RS, Muza SR, Fulco CS, Moore LG, Butterfield GE. Women at altitude: short-term exposure to hypoxia and or alpha(1)-adrenergic blockade reduces insulin sensitivity. J Appl Physiol. 2001;91:623–631. - PubMed
    1. Breslow MJ, Min-Lee K, Brown DR, Chacko VP, Palmer D, Berkowitz DE. Effect of leptin deficiency on metabolic rate in ob/ob mice. Am J Physiol. 1999;276:E443–E449. - PubMed

Publication types

LinkOut - more resources