

Glycosylation affects rat Kv1.1 potassium channel gating by a combined surface potential and cooperative subunit interaction mechanism
- PMID: 12879861
- PMCID: PMC2343013
- DOI: 10.1113/jphysiol.2003.040337
Glycosylation affects rat Kv1.1 potassium channel gating by a combined surface potential and cooperative subunit interaction mechanism
Erratum in
- J Physiol. 2003 Sep 15;551(Pt 3):1059
Abstract
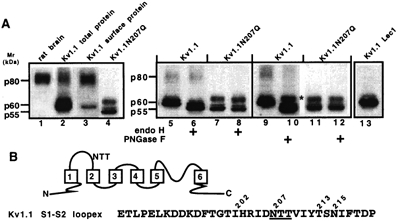
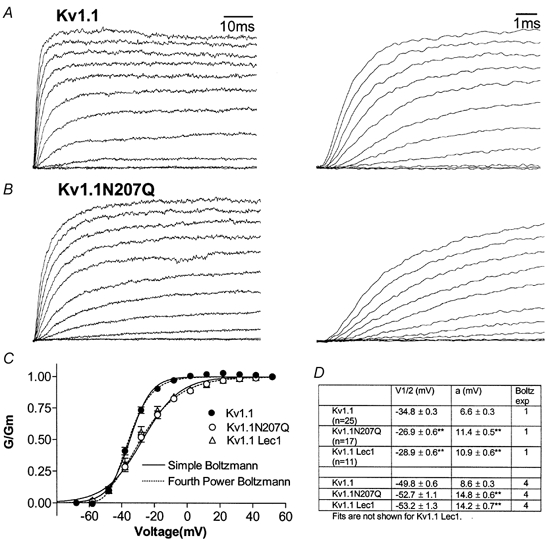
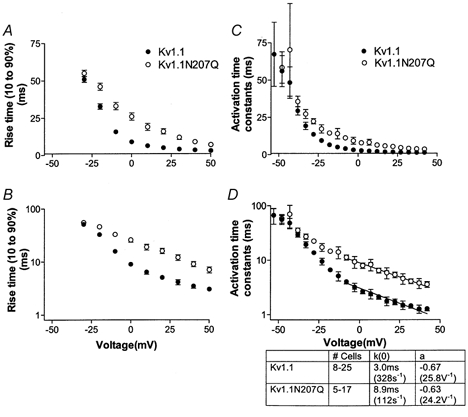
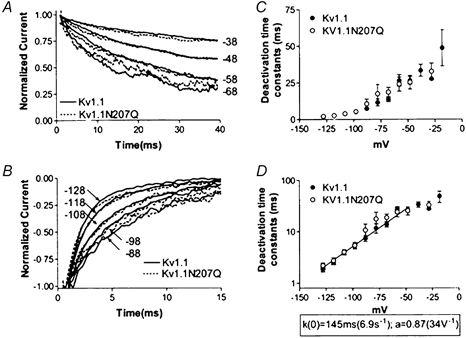
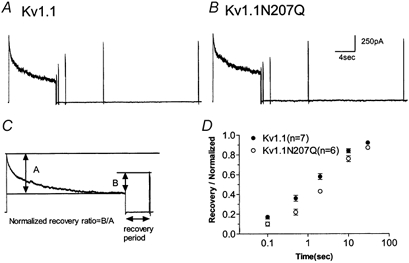
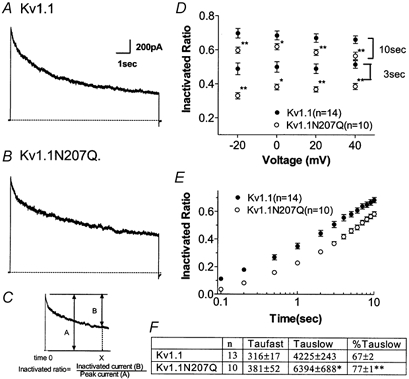
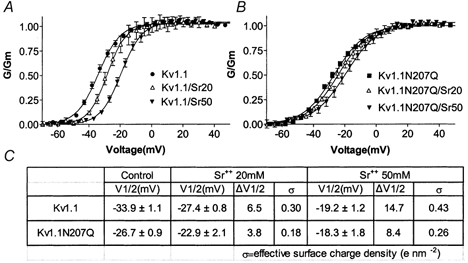
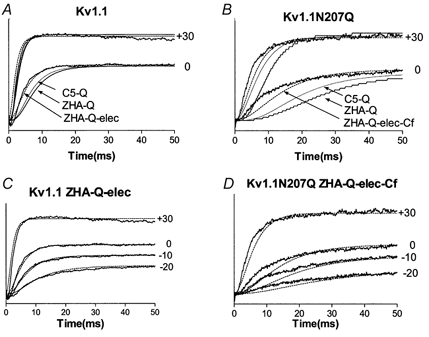
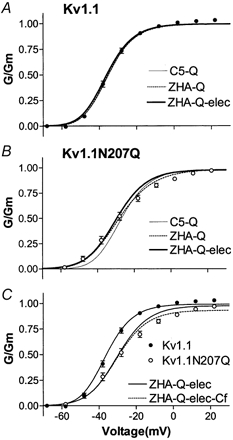
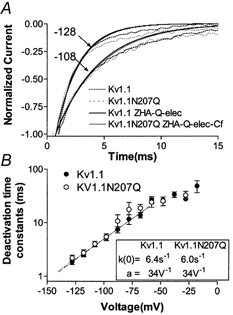
The effect of glycosylation on Kv1.l potassium channel function was investigated in mammalian cells stably transfected with Kv1.l or Kv1.1N207Q. Macroscopic current analysis showed that both channels were expressed but Kv1.1N207Q, which was not glycosylated, displayed functional differences compared with wild-type, including slowed activation kinetics, a positively shifted V 1/2, a shallower slope for the conductance versus voltage relationship, slowed C-type inactivation kinetics, and a reduced extent of and recovery from C-type inactivation. Kv1. 1N207Q activation properties were also less sensitive to divalent cations compared with those of Kv1.l. These effects were largely due to the lack of trans-Golgi added sugars, such as galactose and sialic acid, to the N207 carbohydrate tree. No apparent change in ionic current deactivation kinetics was detected inKv1.1N207Q compared with wild-type. Our data, coupled with modelling, suggested that removal of the N207 carbohydrate tree had two major effects. The first effect slowed the concerted channel transition from the last dosed state to the open state without changing the voltage dependence of its kinetics. This effect contributed to the G-V curve depolarization shift and together with the lower sensitivity to divalent cations suggested that the carbohydrate tree and its negatively charged sialic acids affected the negative surface charge density on the channel's extracellular face that was sensed by the activation gating machinery. The second effect reduced a cooperativity factor that slowed the transition from the open state to the dosed state without changing its voltage dependence. This effect accounted for the shallower G-V slope, and contributed to the depolarized G-V shift, and together with the inactivation changes it suggested that the carbohydrate tree also affected channel conformations. Thus N-glycosylation, and particularly terminal sialylation, affected Kv1.l gating properties both by altering the surface potential sensed by the channel's activation gating machinery and by modifying conformational changes regulating cooperative subunit interactions during activation and inactivation. Differences in glycosylation pattern among closely related channels may contribute to their functional differences and affect their physiological roles.
Figures
Similar articles
-
The glycosylation state of Kv1.2 potassium channels affects trafficking, gating, and simulated action potentials.Brain Res. 2007 May 4;1144:1-18. doi: 10.1016/j.brainres.2007.01.092. Epub 2007 Jan 31. Brain Res. 2007. PMID: 17324383
-
Effects of Kv1.1 channel glycosylation on C-type inactivation and simulated action potentials.Brain Res. 2005 Oct 5;1058(1-2):30-43. doi: 10.1016/j.brainres.2005.07.050. Epub 2005 Sep 8. Brain Res. 2005. PMID: 16153617
-
N-glycans modulate K(v)1.5 gating but have no effect on K(v)1.4 gating.Biochim Biophys Acta. 2010 Mar;1798(3):367-75. doi: 10.1016/j.bbamem.2009.11.018. Epub 2009 Dec 2. Biochim Biophys Acta. 2010. PMID: 19961828
-
Synergistic inhibition of the maximum conductance of Kv1.5 channels by extracellular K+ reduction and acidification.Cell Biochem Biophys. 2005;43(2):231-42. doi: 10.1385/CBB:43:2:231. Cell Biochem Biophys. 2005. PMID: 16049348 Review.
-
Physiologic and pathophysiologic consequences of altered sialylation and glycosylation on ion channel function.Biochem Biophys Res Commun. 2014 Oct 17;453(2):243-53. doi: 10.1016/j.bbrc.2014.06.067. Epub 2014 Jun 24. Biochem Biophys Res Commun. 2014. PMID: 24971539 Free PMC article. Review.
Cited by
-
Assistance for Folding of Disease-Causing Plasma Membrane Proteins.Biomolecules. 2020 May 7;10(5):728. doi: 10.3390/biom10050728. Biomolecules. 2020. PMID: 32392767 Free PMC article. Review.
-
Relating ion channel expression, bifurcation structure, and diverse firing patterns in a model of an identified motor neuron.J Comput Neurosci. 2013 Apr;34(2):211-29. doi: 10.1007/s10827-012-0416-6. Epub 2012 Aug 11. J Comput Neurosci. 2013. PMID: 22878689 Free PMC article.
-
Triple N-glycosylation in the long S5-P loop regulates the activation and trafficking of the Kv12.2 potassium channel.J Biol Chem. 2009 Nov 27;284(48):33139-50. doi: 10.1074/jbc.M109.021519. Epub 2009 Oct 6. J Biol Chem. 2009. PMID: 19808681 Free PMC article.
-
Allowed N-glycosylation sites on the Kv1.2 potassium channel S1-S2 linker: implications for linker secondary structure and the glycosylation effect on channel function.Biochem J. 2003 Nov 1;375(Pt 3):769-75. doi: 10.1042/BJ20030517. Biochem J. 2003. PMID: 12911333 Free PMC article.
-
Ion Channel Modeling beyond State of the Art: A Comparison with a System Theory-Based Model of the Shaker-Related Voltage-Gated Potassium Channel Kv1.1.Cells. 2022 Jan 11;11(2):239. doi: 10.3390/cells11020239. Cells. 2022. PMID: 35053355 Free PMC article.
References
-
- Adelman JP, Bond CT, Pessia M, Maylie J. Episodic ataxia results from voltage-dependent potassium channels with altered functions. Neuron. 1995;15:1449–1454. - PubMed
-
- Ashcroft FM. Ion Channels and Disease. New York: Academic Press; 2000.
-
- Begenisich T. The role of divalent cations in potassium channels. Trends Neurosci. 1988;11:270–273. - PubMed
Publication types
MeSH terms
Substances
Grants and funding
LinkOut - more resources
Full Text Sources
Molecular Biology Databases