

Transcriptional regulatory cascades in development: initial rates, not steady state, determine network kinetics
- PMID: 12883007
- PMCID: PMC170925
- DOI: 10.1073/pnas.1533293100
Transcriptional regulatory cascades in development: initial rates, not steady state, determine network kinetics
Abstract
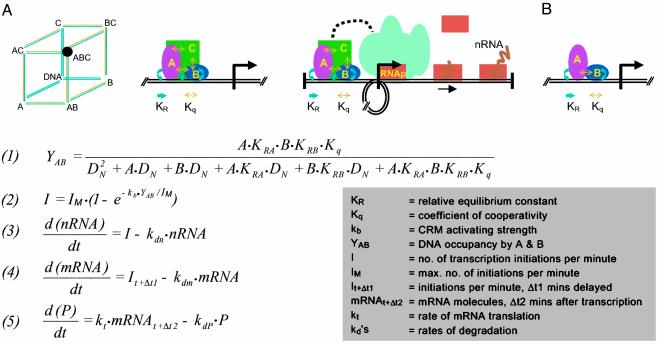
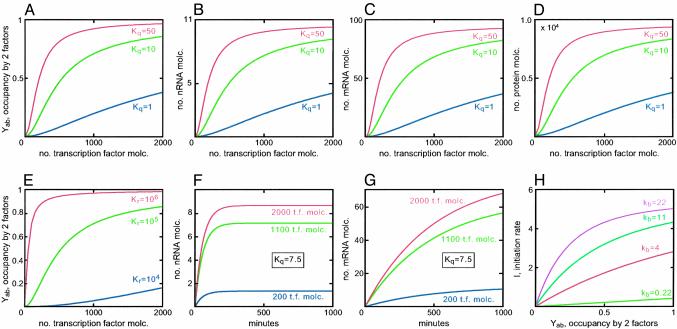
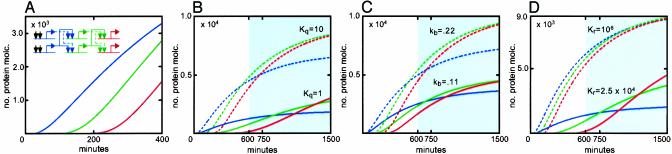
A model was built to examine the kinetics of regulatory cascades such as occur in developmental gene networks. The model relates occupancy of cis-regulatory target sites to transcriptional initiation rate, and thence to RNA and protein output. The model was used to simulate regulatory cascades in which genes encoding transcription factors are successively activated. Using realistic parameter ranges based on extensive earlier measurements in sea urchin embryos, we find that transitions of regulatory states occur sharply in these simulations, with respect to time or changing transcription factor concentrations. As is often observed in developing systems, the simulated regulatory cascades display a succession of gene activations separated by delays of some hours. The most important causes of this behavior are cooperativity in the assembly of cis-regulatory complexes and the high specificity of transcription factors for their target sites. Successive transitions in state occur long in advance of the approach to steady-state levels of the molecules that drive the process. The kinetics of such developmental systems thus depend mainly on the initial output rates of genes activated in response to the advent of new transcription factors.
Figures
Similar articles
-
Response delays and the structure of transcription networks.J Mol Biol. 2003 Jun 13;329(4):645-54. doi: 10.1016/s0022-2836(03)00506-0. J Mol Biol. 2003. PMID: 12787666
-
Modeling the dynamics of transcriptional gene regulatory networks for animal development.Dev Biol. 2009 Jan 15;325(2):317-28. doi: 10.1016/j.ydbio.2008.10.043. Epub 2008 Nov 12. Dev Biol. 2009. PMID: 19028486 Free PMC article. Review.
-
A provisional regulatory gene network for specification of endomesoderm in the sea urchin embryo.Dev Biol. 2002 Jun 1;246(1):162-90. doi: 10.1006/dbio.2002.0635. Dev Biol. 2002. PMID: 12027441
-
Encounters across networks: Windows into principles of genomic regulation.Mar Genomics. 2019 Apr;44:3-12. doi: 10.1016/j.margen.2019.01.003. Epub 2019 Jan 17. Mar Genomics. 2019. PMID: 30661741 Free PMC article.
-
Gene regulation: gene control network in development.Annu Rev Biophys Biomol Struct. 2007;36:191. doi: 10.1146/annurev.biophys.35.040405.102002. Annu Rev Biophys Biomol Struct. 2007. PMID: 17291181 Review.
Cited by
-
Response to Nodal morphogen gradient is determined by the kinetics of target gene induction.Elife. 2015 Apr 14;4:e05042. doi: 10.7554/eLife.05042. Elife. 2015. PMID: 25869585 Free PMC article.
-
sfrp1 promotes cardiomyocyte differentiation in Xenopus via negative-feedback regulation of Wnt signalling.Development. 2013 Apr;140(7):1537-49. doi: 10.1242/dev.088047. Development. 2013. PMID: 23482489 Free PMC article.
-
Major role for mRNA stability in shaping the kinetics of gene induction.BMC Genomics. 2010 Apr 21;11:259. doi: 10.1186/1471-2164-11-259. BMC Genomics. 2010. PMID: 20409322 Free PMC article.
-
Control of transcriptional variability by overlapping feed-forward regulatory motifs.Biophys J. 2008 Oct;95(8):3715-23. doi: 10.1529/biophysj.108.134064. Epub 2008 Jul 11. Biophys J. 2008. PMID: 18621837 Free PMC article.
-
m6 A reader protein YTHDF2 regulates spermatogenesis by timely clearance of phase-specific transcripts.Cell Prolif. 2022 Jan;55(1):e13164. doi: 10.1111/cpr.13164. Epub 2021 Nov 30. Cell Prolif. 2022. PMID: 34850470 Free PMC article.
References
-
- Davidson, E. H. (2001) Genomic Regulatory Systems: Development and Evolution (Academic, San Diego).
-
- Davidson, E. H., Rast, J. P., Oliveri, P., Ransick, A., Calestani, C., Yuh, C.-H., Minokawa, T., Amore, G., Hinman, V., Arenas-Mena, C., et al. (2002) Science 295, 1669–1678. - PubMed
-
- Emerson, B. M., Lewis, C. D. & Felsenfeld, G. (1985) Cell 41, 21–30. - PubMed
Publication types
MeSH terms
Substances
Grants and funding
LinkOut - more resources
Full Text Sources
Research Materials
Miscellaneous
