Congruence of tissue expression profiles from Gene Expression Atlas, SAGEmap and TissueInfo databases
- PMID: 12885301
- PMCID: PMC183867
- DOI: 10.1186/1471-2164-4-31
Congruence of tissue expression profiles from Gene Expression Atlas, SAGEmap and TissueInfo databases
Abstract
Background: Extracting biological knowledge from large amounts of gene expression information deposited in public databases is a major challenge of the postgenomic era. Additional insights may be derived by data integration and cross-platform comparisons of expression profiles. However, database meta-analysis is complicated by differences in experimental technologies, data post-processing, database formats, and inconsistent gene and sample annotation.
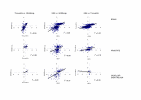
Results: We have analysed expression profiles from three public databases: Gene Expression Atlas, SAGEmap and TissueInfo. These are repositories of oligonucleotide microarray, Serial Analysis of Gene Expression and Expressed Sequence Tag human gene expression data respectively. We devised a method, Preferential Expression Measure, to identify genes that are significantly over- or under-expressed in any given tissue. We examined intra- and inter-database consistency of Preferential Expression Measures. There was good correlation between replicate experiments of oligonucleotide microarray data, but there was less coherence in expression profiles as measured by Serial Analysis of Gene Expression and Expressed Sequence Tag counts. We investigated inter-database correlations for six tissue categories, for which data were present in the three databases. Significant positive correlations were found for brain, prostate and vascular endothelium but not for ovary, kidney, and pancreas.
Conclusion: We show that data from Gene Expression Atlas, SAGEmap and TissueInfo can be integrated using the UniGene gene index, and that expression profiles correlate relatively well when large numbers of tags are available or when tissue cellular composition is simple. Finally, in the case of brain, we demonstrate that when PEM values show good correlation, predictions of tissue-specific expression based on integrated data are very accurate.
Figures

Similar articles
-
Cross-species comparison of gene expression between human and porcine tissue, using single microarray platform--preliminary results.Clin Transplant. 2004;18 Suppl 12:76-80. doi: 10.1111/j.1399-0012.2004.00223.x. Clin Transplant. 2004. PMID: 15217413
-
Annotating nonspecific SAGE tags with microarray data.Genomics. 2006 Jan;87(1):173-80. doi: 10.1016/j.ygeno.2005.08.014. Epub 2005 Nov 28. Genomics. 2006. PMID: 16314072
-
Building comparative gene expression databases for the mouse preimplantation embryo using a pipeline approach to UniGene.Mol Hum Reprod. 2007 Oct;13(10):713-20. doi: 10.1093/molehr/gam050. Epub 2007 Sep 5. Mol Hum Reprod. 2007. PMID: 17804433
-
Microarray expression profiling resources for plant genomics.Trends Plant Sci. 2005 Dec;10(12):603-9. doi: 10.1016/j.tplants.2005.10.003. Epub 2005 Nov 7. Trends Plant Sci. 2005. PMID: 16275051 Review.
-
Co-expression tools for plant biology: opportunities for hypothesis generation and caveats.Plant Cell Environ. 2009 Dec;32(12):1633-51. doi: 10.1111/j.1365-3040.2009.02040.x. Epub 2009 Aug 27. Plant Cell Environ. 2009. PMID: 19712066 Review.
Cited by
-
Combination of novel and public RNA-seq datasets to generate an mRNA expression atlas for the domestic chicken.BMC Genomics. 2018 Aug 7;19(1):594. doi: 10.1186/s12864-018-4972-7. BMC Genomics. 2018. PMID: 30086717 Free PMC article.
-
Meta Analysis of Gene Expression Data within and Across Species.Curr Genomics. 2008 Dec;9(8):525-34. doi: 10.2174/138920208786847935. Curr Genomics. 2008. PMID: 19516959 Free PMC article.
-
A global meta-analysis of microarray expression data to predict unknown gene functions and estimate the literature-data divide.Bioinformatics. 2009 Jul 1;25(13):1694-701. doi: 10.1093/bioinformatics/btp290. Epub 2009 May 15. Bioinformatics. 2009. PMID: 19447786 Free PMC article.
-
Gene Function is a Driver of Activin Signaling Pathway Evolution Following Whole-Genome Duplication in Rainbow Trout (Oncorhynchus mykiss).Genome Biol Evol. 2024 May 2;16(5):evae096. doi: 10.1093/gbe/evae096. Genome Biol Evol. 2024. PMID: 38701021 Free PMC article.
-
Comparison and consolidation of microarray data sets of human tissue expression.BMC Genomics. 2010 May 14;11:305. doi: 10.1186/1471-2164-11-305. BMC Genomics. 2010. PMID: 20465848 Free PMC article.
References
-
- Ross DT, Scherf U, Eisen MB, Perou CM, Rees C, Spellman P, Iyer V, Jeffrey SS, Van de Rijn M, Waltham M, Pergamenschikov A, Lee JC, Lashkari D, Shalon D, Myers TG, Weinstein JN, Botstein D, Brown PO. Systematic variation in gene expression patterns in human cancer cell lines. Nat Genet. 2000;24:227–235. doi: 10.1038/73432. - DOI - PubMed
-
- Itoh K, Okubo K, Utiyama H, Hirano T, Yoshii J, Matsubara K. Expression profile of active genes in granulocytes. Blood. 1998;92:1432–1441. - PubMed
Publication types
MeSH terms
LinkOut - more resources
Full Text Sources
Research Materials

