

The unbinding of ATP from F1-ATPase
- PMID: 12885621
- PMCID: PMC1303195
- DOI: 10.1016/S0006-3495(03)74513-5
The unbinding of ATP from F1-ATPase
Abstract
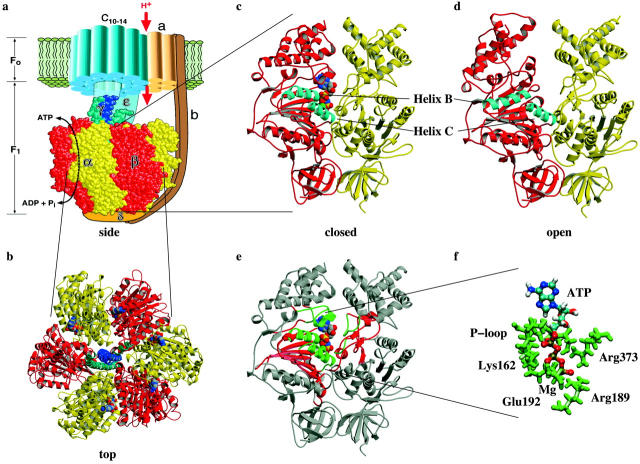
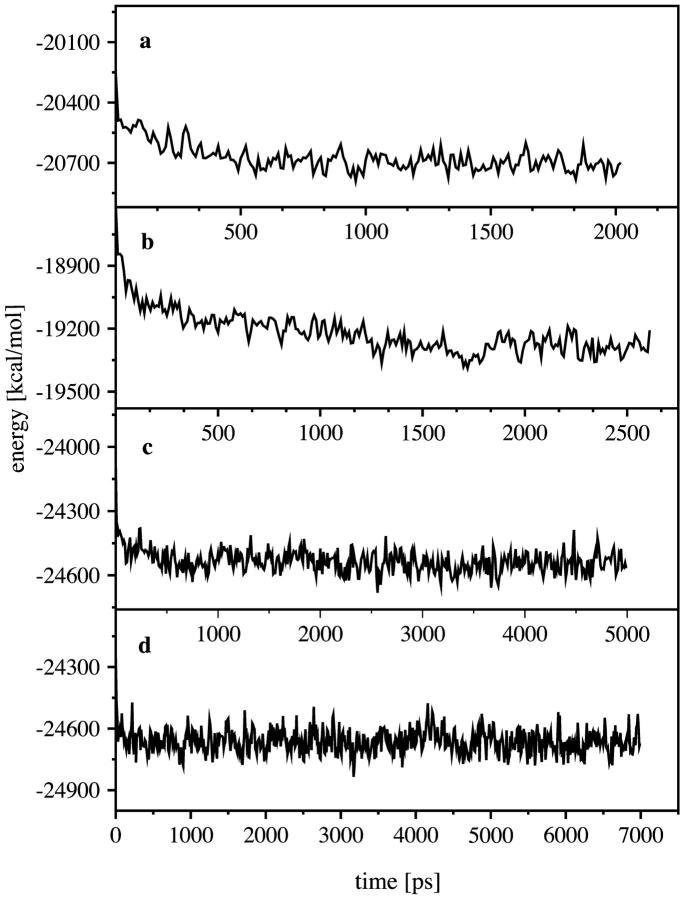
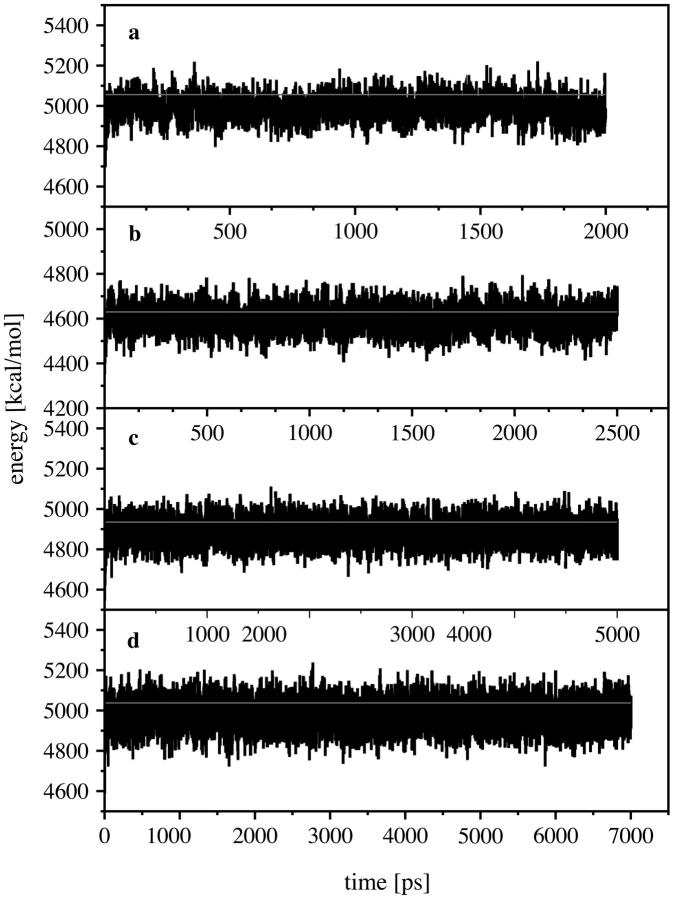
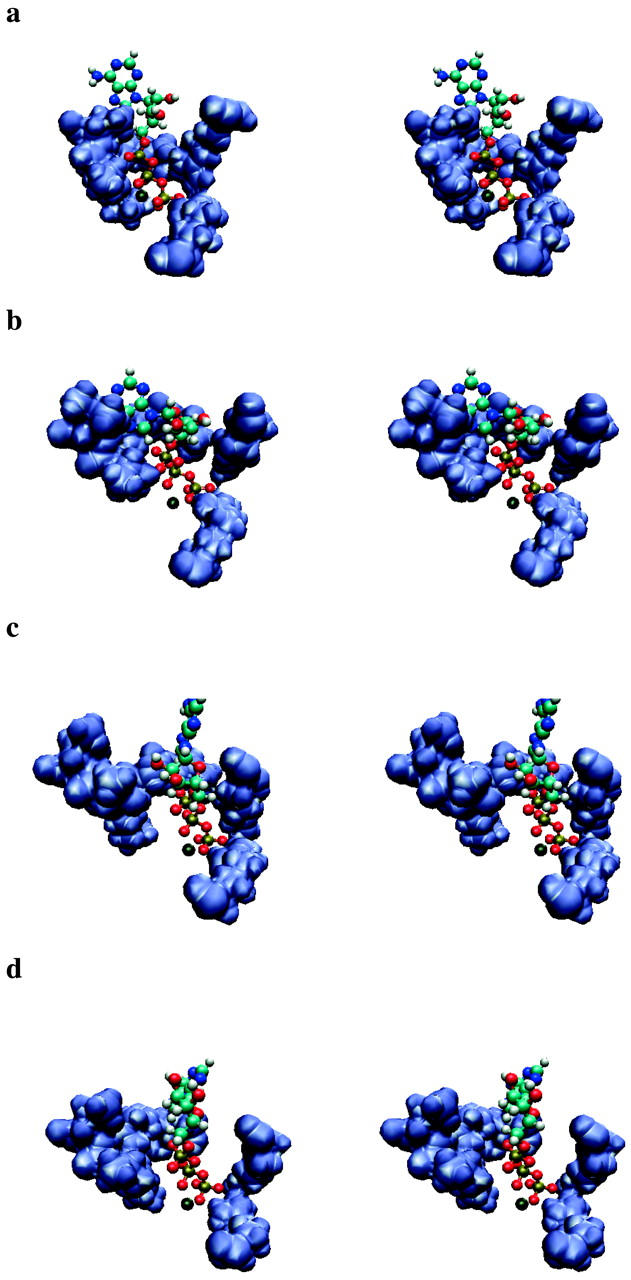
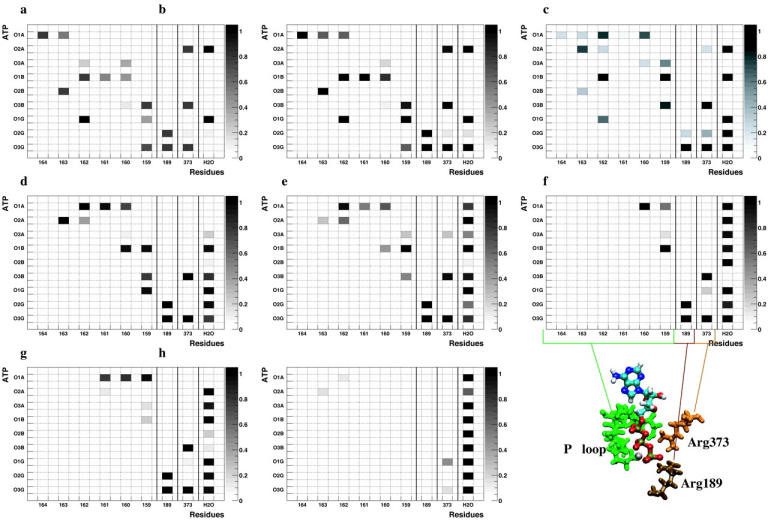
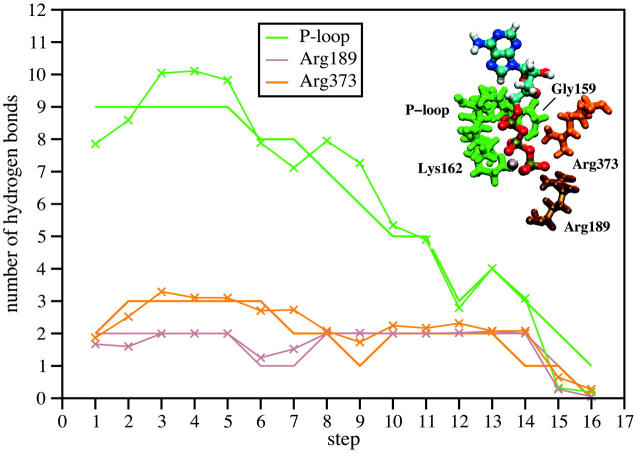
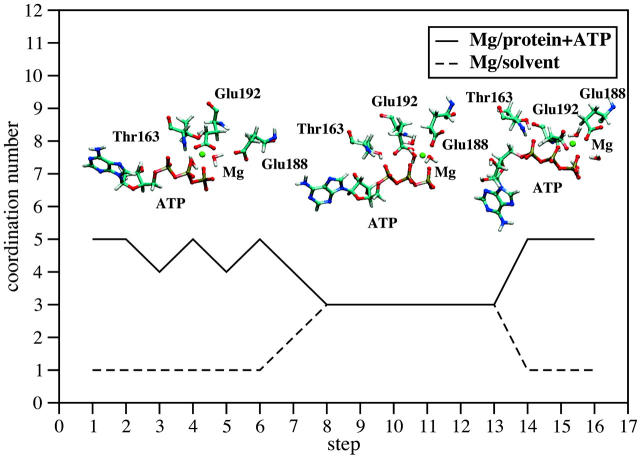
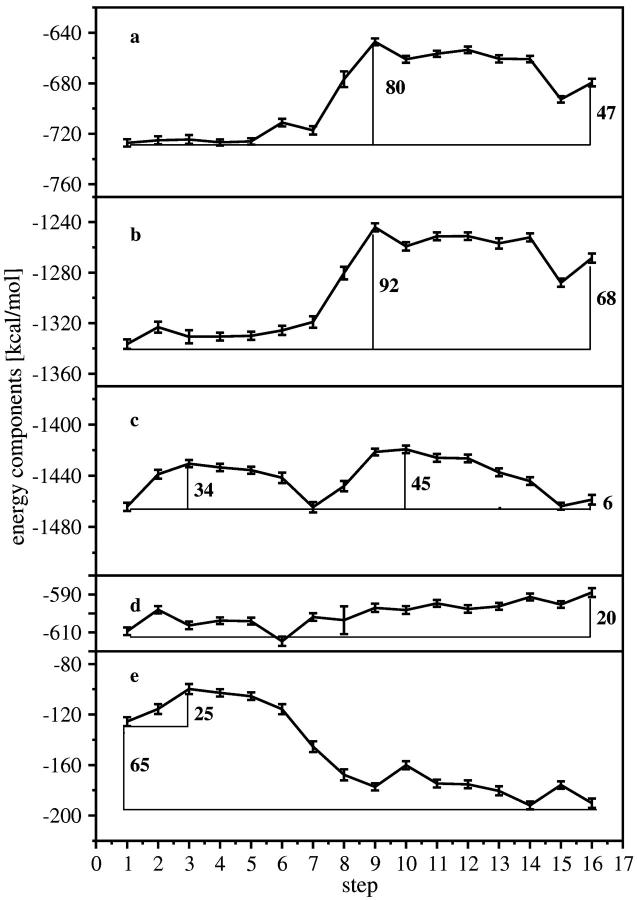
Using molecular dynamics, we study the unbinding of ATP in F(1)-ATPase from its tight binding state to its weak binding state. The calculations are made feasible through use of interpolated atomic structures from Wang and Oster [Nature 1998, 396: 279-282]. These structures are applied to atoms distant from the catalytic site. The forces from these distant atoms gradually drive a large primary region through a series of sixteen equilibrated steps that trace the hinge bending conformational change in the beta-subunit that drives rotation of gamma-subunit. As the rotation progresses, we find a sequential weakening and breaking of the hydrogen bonds between the ATP molecule and the alpha- and beta-subunits of the ATPase. This finding agrees with the "binding-zipper" model [Oster and Wang, BIOCHIM: Biophys. Acta 2000, 1458: 482-510.] In this model, the progressive formation of the hydrogen bonds is the energy source driving the rotation of the gamma-shaft during hydrolysis. Conversely, the corresponding sequential breaking of these bonds is driven by rotation of the shaft during ATP synthesis. Our results for the energetics during rotation suggest that the nucleotide's coordination with Mg(2+) during binding and release is necessary to account for the observed high efficiency of the motor.
Figures
Similar articles
-
Asymmetry in the F1-ATPase and its implications for the rotational cycle.Biophys J. 2004 Mar;86(3):1373-84. doi: 10.1016/S0006-3495(04)74208-3. Biophys J. 2004. PMID: 14990467 Free PMC article.
-
ATP hydrolysis in the betaTP and betaDP catalytic sites of F1-ATPase.Biophys J. 2004 Nov;87(5):2954-67. doi: 10.1529/biophysj.104.046128. Epub 2004 Aug 17. Biophys J. 2004. PMID: 15315950 Free PMC article.
-
Nanoseconds molecular dynamics simulation of primary mechanical energy transfer steps in F1-ATP synthase.Nat Struct Biol. 2002 Mar;9(3):198-202. doi: 10.1038/nsb760. Nat Struct Biol. 2002. PMID: 11836535
-
F(1)-ATPase: a prototypical rotary molecular motor.Adv Exp Med Biol. 2012;726:5-16. doi: 10.1007/978-1-4614-0980-9_2. Adv Exp Med Biol. 2012. PMID: 22297508 Review.
-
Molecular mechanisms of rotational catalysis in the F(0)F(1) ATP synthase.Biochim Biophys Acta. 2000 May 31;1458(2-3):289-99. doi: 10.1016/s0005-2728(00)00081-5. Biochim Biophys Acta. 2000. PMID: 10838045 Review.
Cited by
-
Making ATP.Proc Natl Acad Sci U S A. 2005 Nov 15;102(46):16539-46. doi: 10.1073/pnas.0507207102. Epub 2005 Oct 10. Proc Natl Acad Sci U S A. 2005. PMID: 16217018 Free PMC article.
-
Molecular dynamics and protein function.Proc Natl Acad Sci U S A. 2005 May 10;102(19):6679-85. doi: 10.1073/pnas.0408930102. Epub 2005 May 3. Proc Natl Acad Sci U S A. 2005. PMID: 15870208 Free PMC article.
-
A computational analysis of ATP binding of SV40 large tumor antigen helicase motor.PLoS Comput Biol. 2009 Sep;5(9):e1000514. doi: 10.1371/journal.pcbi.1000514. Epub 2009 Sep 25. PLoS Comput Biol. 2009. PMID: 19779548 Free PMC article.
-
Age-dependent changes in the proteome following complete spinal cord transection in a postnatal South American opossum (Monodelphis domestica).PLoS One. 2011;6(11):e27465. doi: 10.1371/journal.pone.0027465. Epub 2011 Nov 16. PLoS One. 2011. PMID: 22110655 Free PMC article.
-
Simple models for extracting mechanical work from the ATP hydrolysis cycle.Biophys J. 2006 Jun 15;90(12):4281-94. doi: 10.1529/biophysj.105.073320. Epub 2006 Mar 31. Biophys J. 2006. PMID: 16581833 Free PMC article.
References
-
- Abrahams, J. P., A. G. W. Leslie, and J. E. Walker. 1994. Structure at 2.8-angstrom resolution of F1-ATPase from bovine heart-mitochondria. Nature. 370:621–628. - PubMed
-
- Böckmann, R. A., and H. Grubmüller. 2002. Nanoseconds molecular dynamics simulation of primary mechanical energy transfer steps in F1-ATP synthase. Nat. Struct. Biol. 9:198–202. - PubMed
-
- Boyer, P. D. 1993. The binding change mechanism for ATP synthase - some probabilities and possibilities. Biochim. Biophys. Acta. 1140:215–250. - PubMed
-
- Boyer, P. D. 1997. The ATP synthase - A splendid molecular machine. Annu. Rev. Biochem. 66:717–749. - PubMed
-
- Brooks, B. R., R. E. Buccoleri, B. D. Olafson, D. J. States, S. Swaminathan, and M. Karplus. 1983. CHARMM - A program for macromolecular energy, minimization, and dynamics calculations. J. Comput. Chem. 4:187–217.
Publication types
MeSH terms
Substances
Grants and funding
LinkOut - more resources
Full Text Sources
Research Materials
