Comparative Study
. 2003 Aug;85(2):744-54.
doi: 10.1016/S0006-3495(03)74517-2.

Metabolic switching in the sugar phosphotransferase system of Escherichia coli

Affiliations
Comparative Study

Metabolic switching in the sugar phosphotransferase system of Escherichia coli

Mukund Thattai et al. Biophys J. 2003 Aug.

Abstract

Bacteria grown in a mixture of multiple sugars will first metabolize a preferred sugar until it is nearly depleted, only then turning to other carbon sources in the medium. This sharp switching of metabolic preference is characteristic of systems that optimize fitness. Here we consider the mechanism by which switching can occur in the Escherichia coli phosphotransferase system (PTS), which regulates the uptake and metabolism of several sugars. Using a model combining the description of fast biochemical processes and slower genetic regulation, we derive metabolic phase diagrams for the uptake of two PTS sugars, indicating regions of distinct sugar preference as a function of external sugar concentrations. We then propose a classification of bacterial phenotypes based on the topology of the metabolic phase diagram, and enumerate the possible topologically distinct phenotypes that can be achieved through mutations of the PTS. This procedure reveals that there is only one nontrivial switching phenotype that is insensitive to large changes in biochemical parameters. This phenotype exhibits diauxic growth, a manifestation of the winner-take-all dynamics enforced by PTS architecture. Winner-take-all behavior is implemented by the induction of sugar-specific operons, combined with competition between sugars for limited phosphoryl flux. We propose that flux-limited competition could be a common mechanism for introducing repressive interactions in cellular networks, and we argue that switching behavior similar to that described here should occur generically in systems that implement such a mechanism.


Figures

FIGURE 1
FIGURE 1
The PTS system. (A) The PTS cascade. The enzymes EI and HPr form the general PTS, whereas EIIA and EIIBC form the sugar-specific PTS. The cascade of PTS enzymes catalyzes the transfer of a phosphoryl group from PEP to a carbohydrate, glucose (G) in the case shown, and drives the transportation of that carbohydrate into the cytoplasm; in the process, PEP is converted into Pyr. Each phosphotransfer reaction is reversible, with forward rate constant k and backward rate constant formula image but the final translocation of the carbohydrate is essentially irreversible. (B) The phosphotransfer branch point and flux-limited competition between different PTS sugars Sj. Total phosphoryl flux J is split into sugar-specific fluxes Jj (j = 1 … m). Flux-limited competition is mediated by the fraction f of phosphorylated HPr. Intracellular sugars induce their specific operons (local activation), but compete with each other for phosphoryl flux (global inhibition), thus creating a WTA-type network.
FIGURE 2
FIGURE 2
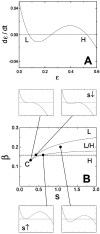
Single-sugar uptake. (A) Graphical solution to Eq. 9 for υ = 0.05, β = 0.2, and S = 1.0. Stable fixed points are labeled as high, H, or low, L. (B) System behavior for υ = 0.05. Discontinuous transitions can occur as the sugar concentration S is varied at fixed β (dashed line). For low sugar concentrations, only the low fixed point is present, so the operon expression ɛ is low, L; the concentration must pass some threshold S↑ before the operon can be induced to a high state, H. Similarly, S must fall below some S↓ before ɛ again switches to a low state. The region L/H is thus hysteretic, admitting two stable fixed points. Dynamical behaviors at various parameter values are shown in boxes; box labels and scale are as in Fig. 2 A. Note the critical point, C, that indicates the onset of bistability.
FIGURE 3
FIGURE 3
Two-sugar uptake. We summarize operon induction levels as being either high, H, or low, L, for each sugar; we summarize system behavior by indicating all of the stable fixed points that obtain. For example, LH represents a state in which production of ɛ2 alone is induced, so S2 alone is metabolized; LL/HL/LH represents a state in which three distinct fixed points occur at once. (A) Independent hysteretic switches. A single hysteretic system goes through the states L, L/H, and H as S1 is varied from 0 to ∞. If we assume a similar but independent control mechanism for the uptake of another sugar, S2, the combined switching dynamics will be as shown in the figure. (BD) PTS metabolic phase diagrams indicate operon expression levels as a function of external sugar concentrations. Discontinuous transitions occur across lines in {S1,S2} space. Diagrams are obtained by numerical solution for three parameter values {υ,β}: (B) {0.0625, 0.2}, (C) {0.077, 0.2}, and (D) {0.25, 0.25}. Stochastic effects will cause a population of bacteria to occupy all of the available fixed points simultaneously, but the majority of bacteria will occupy the most stable fixed point. In D, this creates a transition line (dashed) across which the most stable fixed point (indicated in circles) goes from HL to LH. (E) An optimal metabolic strategy for growth on two sugars. The optimal choice of sugar switches discontinuously across the dotted line, from S1 below to S2 above; the desired enzymatic state is therefore HL below the line, and LH above it. Note that the population-averaged switching behavior of the phenotype in D is consistent with the optimal metabolic strategy shown in E.
FIGURE 4
FIGURE 4
Phenotypic classification. Lines in {υ,β} space indicate transitions between topologically distinct metabolic phase diagrams, each of which can be associated with a possible bacterial phenotype. The 12 possible topologically distinct phase diagrams are indicated schematically in boxes, along with their corresponding parameter regions. The main graph shows a detailed portion of {υ,β} space so that fine transitions can be distinguished; the inset (showing the entire extent of transition lines in {υ,β} space) places emphasis on the three phenotypes that occupy the largest parameter regions. (A) The nonswitching phenotype. (B) The WTA phenotype. (C) The low basal transcription phenotype. The phenotype, B, shown in a bold box (and also in Fig. 3 D) is the only robust, nontrivial switching phenotype generated by the PTS.
FIGURE 5
FIGURE 5
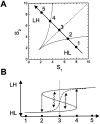
Switching dynamics of WTA phenotype: hysteresis and stochastic transitions. The dynamics along a cut in {S1,S2} space (A) are depicted schematically in B. The solid curve shows the fixed points obtained by solving Eq. 10; the upper, LH, and lower, HL, branches of this curve are the stable fixed points, whereas the middle branch is unstable. If the system begins in the HL state (1), then it will stay HL until it is moved to (4), where the HL fixed point vanishes, causing the system to transition to the LH state. Going in the opposite direction, a system that begins in the LH state (5) must be moved to (2) before it transitions back to the HL state. These hysteretic transitions (solid arrows) only occur when one or the other stable fixed point vanishes. However, stochastic fluctuations can cause transitions from one stable fixed point to another (wavy arrows). Hysteresis will only be observed if sugar concentrations are changed very fast so stochastic transitions do not have time to occur, or if stochastic fluctuations are small, making large transitions unlikely. Over time, these fluctuations will cause a population of bacteria to split into two subpopulations, one near each fixed point, and the majority of cells will occupy the most stable fixed point (that which is furthest from the unstable fixed point). The population average (dashed curve) will therefore switch sharply around (3), the point at which an equal number of cells occupy each fixed point. The position of the switching boundary (vertical dashed line) will be shifted if the subpopulations have different growth rates; for example, if cells in the LH state tend to grow faster, the transition line will be shifted to the left.
FIGURE 6
FIGURE 6
Switching dynamics of WTA phenotype: diauxic growth. The complete hysteretic system can be visualized as a folded sheet, a slice of which was shown in Fig. 5 B. Bacteria on the topmost fold are in the LH state, metabolizing S2 alone; those on the lowest fold are in the HL state, metabolizing S1 alone. The folded sheet in the upper diagram is projected onto a two-dimensional surface in the lower diagram using our usual HL/LH notation; vertical lines connect points of equal {S1,S2} value. The depletion of sugars through metabolism causes sugar concentrations to change slowly over time. We follow two types of concentration trajectories (bold arrows): (1) a bacterial population that is initially entirely in the LH state metabolizes S2 alone; concentrations therefore move parallel to the S2 axis. When the system reaches the transition boundary at which the LH fixed point is lost, ɛ1 must be newly synthesized to reach the HL fixed point; as the system “falls over the edge,” there is a lag in growth. Once in the HL state, the population metabolizes S1 alone, and concentrations move parallel to the S1 axis. The population thus achieves diauxic growth. (2) A population that is initially heterogenous, consisting of both HL and LH subpopulations, metabolizes both S1 and S2; this generates a diagonal concentration trajectory. The transition boundary is only reached at very low sugar concentrations, by which time the bacterial population is likely to be in stationary phase. Diauxie is therefore not observed. Note that it is possible to go from the HL to the LH state without switching at all, by employing a trajectory that goes around the cusp or critical point of the phase diagram.
FIGURE 7
FIGURE 7
PTS chemical kinetics. (A) The PTS and glycolysis. Once transported into the cell, phosphorylated carbohydrates enter the glycolytic pathway with effective overall rate constant kgly. This reaction produces two molecules of PEP for each molecule of input monosaccharide, thus closing the PTS loop. The conversion of PEP into Pyr by the enzyme pyruvate kinase produces one molecule of ATP; this reaction occurs with effective rate constant kpyk. Both PEP and Pyr are subsequently converted into downstream metabolites in reactions with rate constants γPEP and γPyr, respectively; Pyr, in particular, can participate in further energy synthesis. We show the reaction fluxes that are achieved in steady state, given a phosphoryl flux J through the PTS; the ratio f0 = [PEP]/[Pyr] = γPyr/(γPEP + 2kpyk) is independent of J. (B) PTS modules. We represent the PTS components as ai, and the corresponding phosphorylated species as Ai. The phosphotransfer reaction in the a2a3 step is in equilibrium, so equal fractions f of HPr and EIIA are phosphorylated.

References

    1. Alon, U., M. G. Surette, N. Barkai, and S. Leibler. 1999. Robustness in bacterial chemotaxis. Nature. 397:168–171. - PubMed
    1. Botsford, J. L., and J. G. Harman. 1992. Cyclic AMP in prokaryotes. Microbiol. Rev. 56:100–122. - PMC - PubMed
    1. Chung, J. D., and G. Stephanopoulos. 1996. On physiological multiplicity and population heterogeneity of biological systems. Chem. Eng. Sci. 51:1509–1521.
    1. Danzig, G. B. 1963. Linear Programming and Extensions. Princeton University Press, Princeton, NJ.
    1. Edwards, J. S., R. U. Ibarra, and B. Ø. Palsson. 2001. In silico predictions of Escherichia coli metabolic capabilities are consistent with experimental data. Nat. Biotechnol. 19:125–130. - PubMed

Publication types

MeSH terms

Substances

LinkOut - more resources