

Partitioning of individual flexible polymers into a nanoscopic protein pore
- PMID: 12885637
- PMCID: PMC1303211
- DOI: 10.1016/S0006-3495(03)74529-9
Partitioning of individual flexible polymers into a nanoscopic protein pore
Abstract
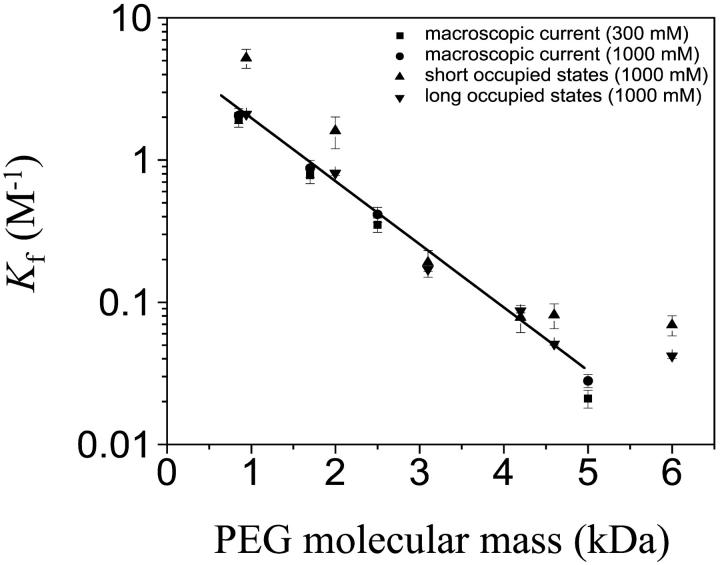
Polymer dynamics are of fundamental importance in materials science, biotechnology, and medicine. However, very little is known about the kinetics of partitioning of flexible polymer molecules into pores of nanometer dimensions. We employed electrical recording to probe the partitioning of single poly(ethylene glycol) (PEG) molecules, at concentrations near the dilute regime, into the transmembrane beta-barrel of individual protein pores formed from staphylococcal alpha-hemolysin (alphaHL). The interactions of the alpha-hemolysin pore with the PEGs (M(w) 940-6000 Da) fell into two classes: short-duration events (tau approximately 20 micro s), approximately 85% of the total, and long-duration events (tau approximately 100 micro s), approximately 15% of the total. The association rate constants (k(on)) for both classes of events were strongly dependent on polymer mass, and values of k(on) ranged over two orders of magnitude. By contrast, the dissociation rate constants (k(off)) exhibited a weak dependence on mass, suggesting that the polymer chains are largely compacted before they enter the pore, and do not decompact to a significant extent before they exit. The values of k(on) and k(off) were used to determine partition coefficients (Pi) for the PEGs between the bulk aqueous phase and the pore lumen. The low values of Pi are in keeping with a negligible interaction between the PEG chains and the interior surface of the pore, which is independent of ionic strength. For the long events, values of Pi decrease exponentially with polymer mass, according to the scaling law of Daoud and de Gennes. For PEG molecules larger than approximately 5 kDa, Pi reached a limiting value suggesting that these PEG chains cannot fit entirely into the beta-barrel.
Figures


Similar articles
-
Interactions of peptides with a protein pore.Biophys J. 2005 Aug;89(2):1030-45. doi: 10.1529/biophysj.104.057406. Epub 2005 May 27. Biophys J. 2005. PMID: 15923222 Free PMC article.
-
Partitioning of a polymer into a nanoscopic protein pore obeys a simple scaling law.Proc Natl Acad Sci U S A. 2001 Aug 28;98(18):10137-41. doi: 10.1073/pnas.181089798. Epub 2001 Aug 14. Proc Natl Acad Sci U S A. 2001. PMID: 11504913 Free PMC article.
-
Mechanism of KCl enhancement in detection of nonionic polymers by nanopore sensors.Biophys J. 2008 Dec;95(11):5186-92. doi: 10.1529/biophysj.108.140814. Epub 2008 Sep 19. Biophys J. 2008. PMID: 18805926 Free PMC article.
-
Threading synthetic polyelectrolytes through protein pores.J Chem Phys. 2007 Feb 7;126(5):051101. doi: 10.1063/1.2435717. J Chem Phys. 2007. PMID: 17302462
-
Probing protein nanopores with poly(ethylene glycol)s.Proteomics. 2022 Mar;22(5-6):e2100055. doi: 10.1002/pmic.202100055. Epub 2022 Jan 24. Proteomics. 2022. PMID: 35030301 Review.
Cited by
-
An outer membrane protein undergoes enthalpy- and entropy-driven transitions.Biochemistry. 2012 Jul 3;51(26):5348-58. doi: 10.1021/bi300332z. Epub 2012 Jun 20. Biochemistry. 2012. PMID: 22680931 Free PMC article.
-
Laser-based temperature control to study the roles of entropy and enthalpy in polymer-nanopore interactions.Sci Adv. 2021 Apr 21;7(17):eabf5462. doi: 10.1126/sciadv.abf5462. Print 2021 Apr. Sci Adv. 2021. PMID: 33883140 Free PMC article.
-
Enhanced translocation of single DNA molecules through alpha-hemolysin nanopores by manipulation of internal charge.Proc Natl Acad Sci U S A. 2008 Dec 16;105(50):19720-5. doi: 10.1073/pnas.0808296105. Epub 2008 Dec 5. Proc Natl Acad Sci U S A. 2008. PMID: 19060213 Free PMC article.
-
Redesign of a plugged beta-barrel membrane protein.J Biol Chem. 2011 Mar 11;286(10):8000-8013. doi: 10.1074/jbc.M110.197723. Epub 2010 Dec 28. J Biol Chem. 2011. PMID: 21189254 Free PMC article.
-
About the Influence of PEG Spacers on the Cytotoxicity of Titanate Nanotubes-Docetaxel Nanohybrids against a Prostate Cancer Cell Line.Nanomaterials (Basel). 2021 Oct 15;11(10):2733. doi: 10.3390/nano11102733. Nanomaterials (Basel). 2021. PMID: 34685172 Free PMC article.
References
-
- Ambjornsson, T., S. P. Apell, Z. Konkoli, E. A. Di Marzio, and J. J. Kasianowicz. 2002. Charged polymer membrane translocation. J. Chem. Phys. 117:4063–4073.
-
- Bayley, H., O. Braha, and L.-Q. Gu. 2000. Stochastic sensing with protein pores. Adv. Matter. 12:139–142.
-
- Bayley, H., and P. S. Cremer. 2001. Stochastic sensors inspired by biology. Nature. 413:226–230. - PubMed
Publication types
MeSH terms
Substances
LinkOut - more resources
Full Text Sources
Other Literature Sources
Research Materials
Miscellaneous
